Pivot tables are one of several Excel tools for extracting meaning out of large groups of numeric data. They can be applied whenever raw data in a spreadsheet or database has to be summarized.
What Is a Pivot Table?
A pivot table is a condensed version of a spreadsheet or database that makes it easier to observe trends, movements, and patterns in the data. It can be used to extract insights from categories and subcategories of numeric data without writing formulas. It is also used as a data visualization tool, alongside pivot charts, for making visual reports of summarized data.
You can take a dataset containing thousands or even millions of entries and create a simple, organized pivot table that is much easier to understand and interpret.
Pivot tables extract data from the columns and rows in your spreadsheet. They work best with data presented in a tabular format, with no empty rows or columns.
Creating a Pivot Table in Excel
To best understand pivot tables, you need to work with them yourself. While pivot tables were created to summarize large groups of data, they can be used with datasets of any size.
For the best results, you need to ensure that your data is arranged in a tabular format and that there are no empty rows or columns. Also, there should be only one data type per column, i.e. no dates in the currency column and no names in the income column.
To create a PivotTable in Microsoft Excel, follow the steps below:
- Open the Excel spreadsheet you wish to analyze.
- Ensure your data has no empty rows or columns and only has a single row heading.
- Select Insert from the menu options and click on Table.
- By highlighting your data, select the cells you want to create a Pivot Table from.
- Select PivotTable from the Insert tab.
- In the pop-up window, ensure that the Table/Range is correct. You can click columns while holding the Shift button to add them to the selection.
- Next, select where you want the PivotTable report to be placed.
- Select New worksheet to place the PivotTable in a new worksheet. If you select Existing worksheet, you can choose the location you want the PivotTable to appear within the same spreadsheet.
- Choose OK to create the Pivot Table
Common Uses for Pivot Tables in Excel
Pivot tables should be your first resort when you need to quickly summarize large amounts of numeric data in a worksheet. They can be used for a wide range of purposes, such as:
Budget Analysis
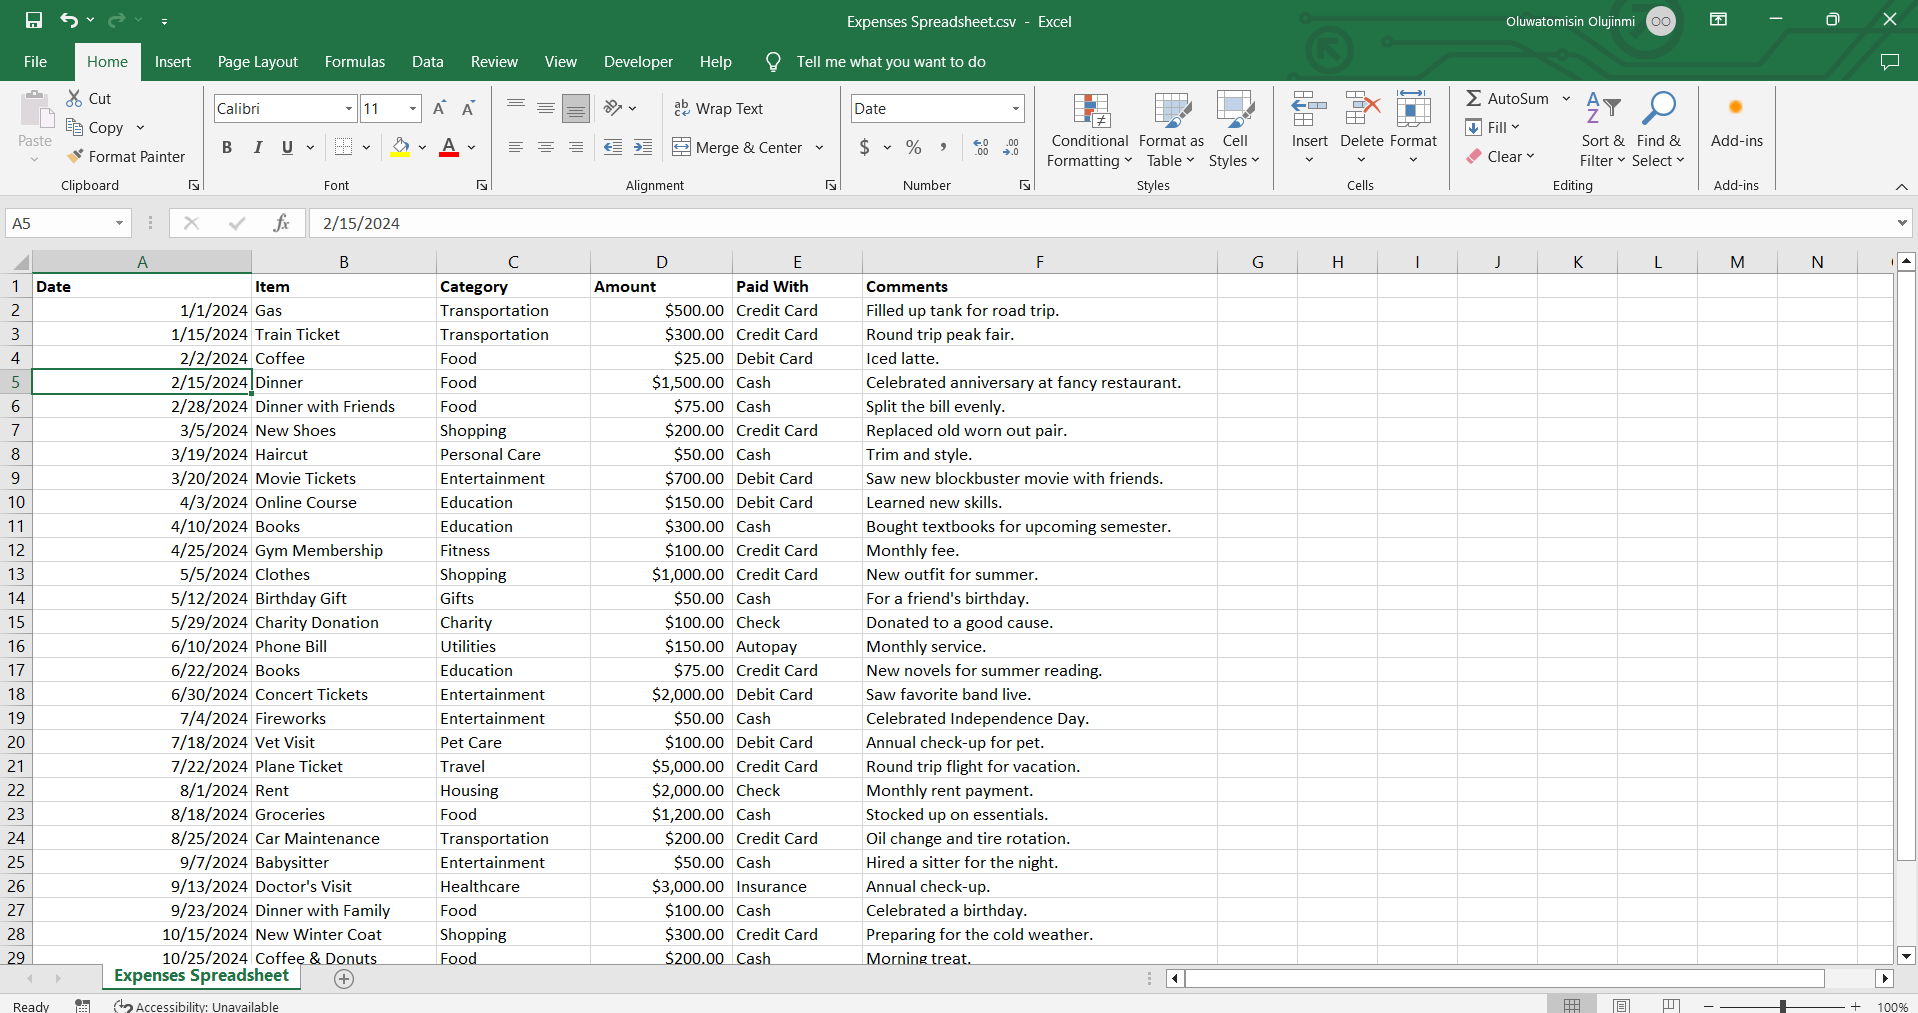
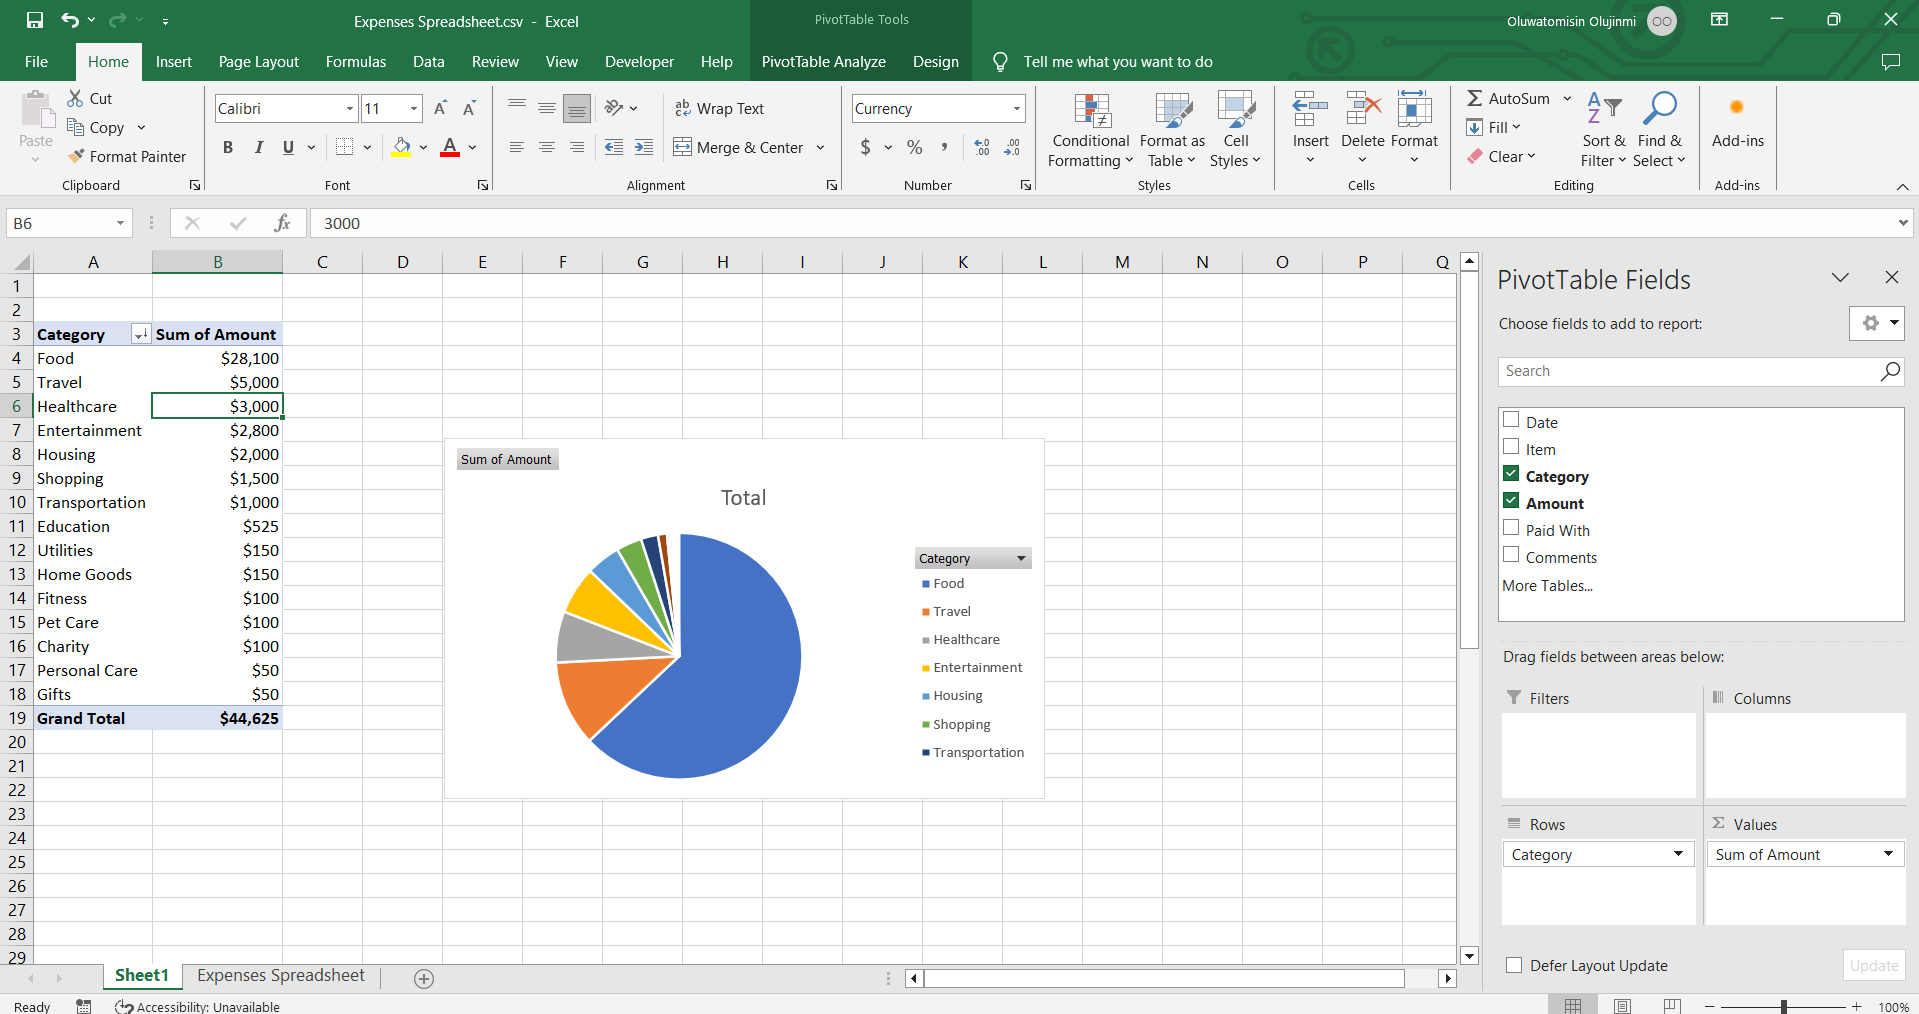
You can use a pivot table to analyze your expenses and revenue by category to determine areas where savings can be made. For example, let’s say I have all my monthly income and expenses tracked in a spreadsheet.
With a pivot table, I can add the total amount of money expended in each category and find out how my money is being spent without using formulas.
Without a pivot table, I would have to write SUMIFs formulas for each category.
Project Management
If you use Excel for managing personal projects, you will find pivot tables quite useful for tracking tasks, project costs, and deadlines. With a spreadsheet that shows project tasks, due dates, and allocated resources, a pivot table can be used to identify tasks that are behind schedule or over budget. It can tell you that a specific project is on track but has exceeded its budget due to unexpected costs.
Keep in mind that pivot tables can only be used to analyze numeric data.
Health and Fitness Tracking
Pivot tables can help you track your progress in different aspects of your life. For instance, you can create a health and fitness spreadsheet, with details on your exercise activities, total time spent, calories burnt, overall level of exertion, nutrition, and sleep.
A pivot table can help you determine the exercise activities you are spending most of your time on and how close you are to hitting your goals. It can tell your average workout time and help you decide on any improvements to your current workout strategy. It could show that you’ve been consistently meeting your protein intake goals but need more sleep.
You can use a similar spreadsheet to track your hobbies and ensure that you have invested the desired amount of time in each one.
Creating pivot tables is as easy and intuitive as it gets. It is a handy skill to have in your data manipulation arsenal and can help you answer important questions about any dataset. Now that you have gotten the fundamentals down, check out advanced Pivot Table functions in Excel.


