
- The US Dollar trades flat after Ukraine and Russian delegates ended meeting in Turkey without any resolution.
- Traders remain unsensitive to the dip in Michigan Consumer Sentiment Index for May.
- The US Dollar Index trades below 101.00, trying to find a floor.
The US Dollar Index (DXY), which tracks the performance of the US Dollar (USD) against six major currencies, is trading flat around 100.80. The DXY is for now able to avoid a weekly loss while market participants are starting to raise questions over the stability of the Greenback. With United States (US) President Donald Trump flip-flopping on its tariff approach and how ill-conceived the first trade deals are, traders are starting to challenge the viability of the grand scheme from the Trump administration and its meaning towards the Greenback.
The US Dollar retreated on Thursday after a slew of economic data pointed that price pressures and consumer spending are cooling. The Producer Price Index (PPI) data unexpectedly showed prices fell in April compared with the previous month, while Retail Sales grew by a marginal 0.1% after March’s 1.5% surge.
President Trump said the U.S. will unilaterally set tariffs for many countries soon. Speaking on his Middle East tour, the president said 150 countries were seeking to making a deal, “but you’re not able to see that many countries.” Trump said Treasury Secretary Scott Bessent and Commerce Secretary Howard Lutnick would tell countries what import duties the U.S. plans to impose. “So at a certain point over the next two to three weeks, I think Scott and Howard will be sending letters out, essentially telling people- it will be very fair but we will be telling people what they will be paying to do business in the United States,” Trump said, Bloomberg reports.
Daily digest market movers: Not much market moving
- Both Ukraine and Russian delegations entered in talks in Istanbul, but did not deliver any fruitful outcome with talks being concluded this Friday, Bloomberg reports.
- The US economic calendar meanwhile saw some data come out:
-
- April’s monthly Housing Starts fell to 1.361 million, coming from 1.37 million in March.
- April’s Import-Export Price Indexes came out as well. Export prices came in at 0.1% from 0.1% previously where -0.5% was expected. Import prices came in higher at 0.1%, missing the contraction of -0.4%, and up from the previous -0.4% contraction.
- The University of Michigan published its preliminary report for May:
-
- The Consumer Sentiment Index fell to 50.8, missing the 53.4 estimated and down from 52.2 in April’s final reading.
- The 5-year inflation expectation jumped to 4.6%, missing the 4.4% previous reading.
- Equities are struggling and are falling flat on the day looking for direction, after the drop in Consumer Sentiment in the May’s Michigan reading.
- The CME FedWatch tool shows the chance of an interest rate cut by the Federal Reserve in June’s meeting at just 8.2%. Further ahead, the July 30 decision sees odds for rates being lower than current levels at 38.6%.
- The US 10-year yields trade around 4.41%, softening from its peak performance on early Thursday at 4.54%
US Dollar Index Technical Analysis: Going Nowhere
The US Dollar Index could be on the verge of a crisis as an increasing number of financial market participants start to question the stability status of the Greenback, given the unstable policies of the Trump administration. The “Trump put” is becoming an actual theme, and in this scenario it isn’t likely that the US Dollar revisits levels such as 107.00 or 110.00 for a long time. Add in the fear of a joint Asian currency intervention, where local currencies are appreciated against the Greenback, and US exceptionalism might be over for an extended period of time.
On the upside, 101.90 is the first big resistance again. It already acted as a pivotal level throughout December 2023 and as a base for the inverted head-and-shoulders (H&S) formation during the summer of 2024. In case Dollar bulls push the DXY even higher, the 55-day Simple Moving Average (SMA) at 102.06 comes into play.
On the other hand, the previous resistance at 100.22 is now acting as firm support, followed by the year-to-date low of 97.91 and the pivotal level of 97.73. Further below, a relatively thin technical support comes in at 96.94 before looking at the lower levels of this new price range. These would be at 95.25 and 94.56, meaning fresh lows not seen since 2022.
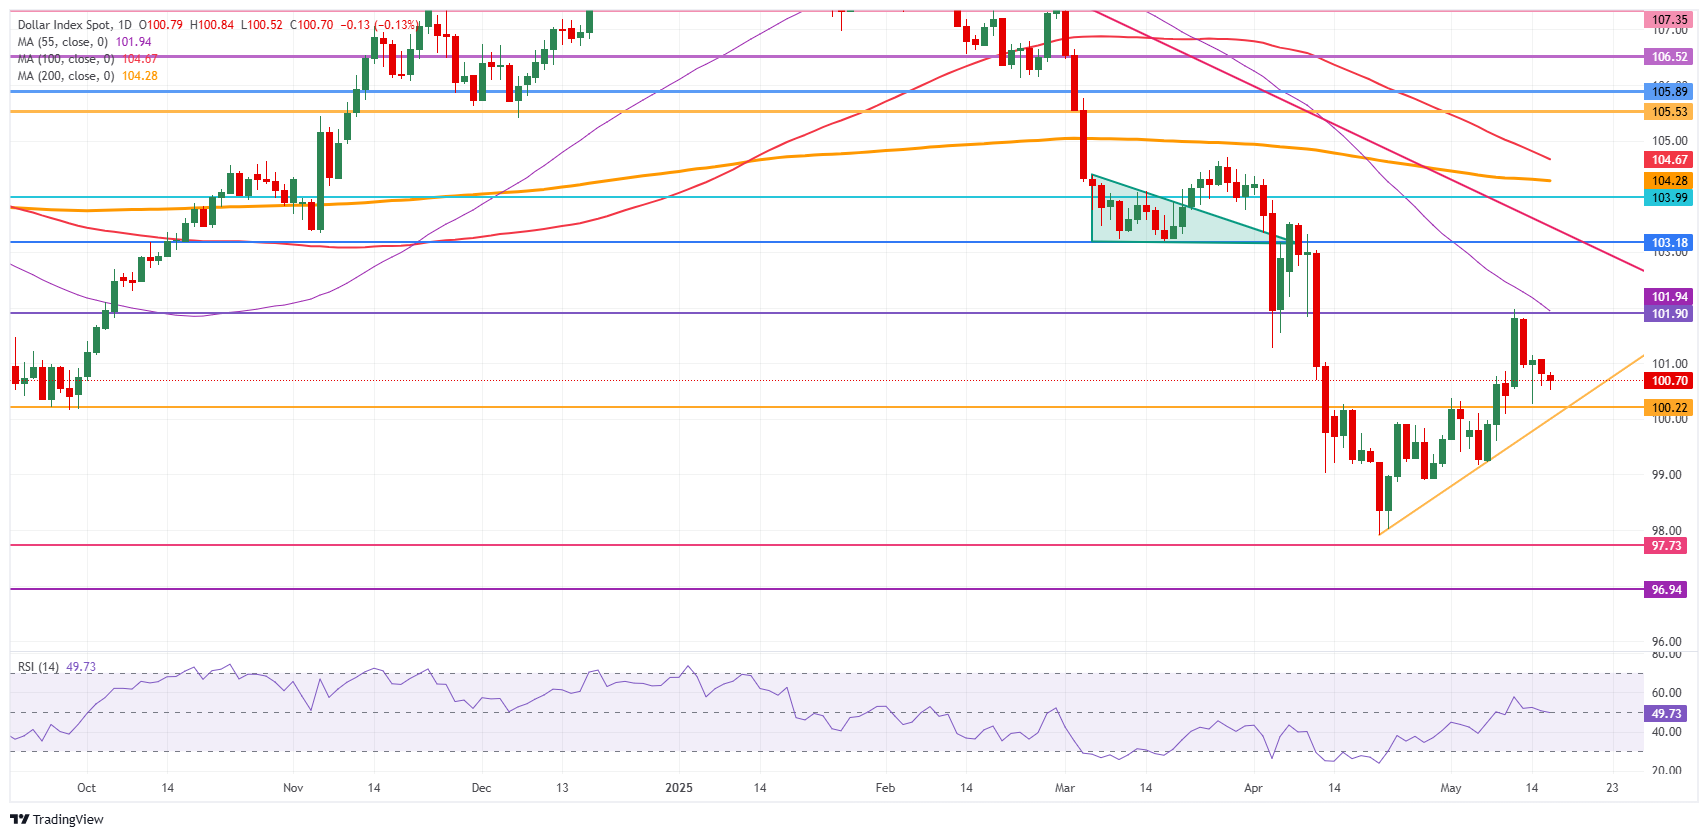
US Dollar Index: Daily Chart
Fed FAQs
Monetary policy in the US is shaped by the Federal Reserve (Fed). The Fed has two mandates: to achieve price stability and foster full employment. Its primary tool to achieve these goals is by adjusting interest rates.
When prices are rising too quickly and inflation is above the Fed’s 2% target, it raises interest rates, increasing borrowing costs throughout the economy. This results in a stronger US Dollar (USD) as it makes the US a more attractive place for international investors to park their money.
When inflation falls below 2% or the Unemployment Rate is too high, the Fed may lower interest rates to encourage borrowing, which weighs on the Greenback.
The Federal Reserve (Fed) holds eight policy meetings a year, where the Federal Open Market Committee (FOMC) assesses economic conditions and makes monetary policy decisions.
The FOMC is attended by twelve Fed officials – the seven members of the Board of Governors, the president of the Federal Reserve Bank of New York, and four of the remaining eleven regional Reserve Bank presidents, who serve one-year terms on a rotating basis.
In extreme situations, the Federal Reserve may resort to a policy named Quantitative Easing (QE). QE is the process by which the Fed substantially increases the flow of credit in a stuck financial system.
It is a non-standard policy measure used during crises or when inflation is extremely low. It was the Fed’s weapon of choice during the Great Financial Crisis in 2008. It involves the Fed printing more Dollars and using them to buy high grade bonds from financial institutions. QE usually weakens the US Dollar.
Quantitative tightening (QT) is the reverse process of QE, whereby the Federal Reserve stops buying bonds from financial institutions and does not reinvest the principal from the bonds it holds maturing, to purchase new bonds. It is usually positive for the value of the US Dollar.

