
- The US Dollar drops further against most major peers for a third day in a row.
- ADP numbers are coming un substantially softer than expected.
- The US Dollar Index DXY faces over 2% devaluation so far this week.
The US Dollar Index (DXY), which tracks the performance of the US Dollar (USD) against six major currencies, deepens out its losses for the third day in a row this week and trades near 105.00 at the time of writing on Wednesday, the lowest level since early November. The downward move comes as traders further unwind their overall Dollar exposure now that several analysts are calling the end of the United States (US) exceptionalism amid concerns that US President Donald Trump’s tariffs could damage economic growth. The move comes ahead of the European Central Bank (ECB) rate decision on Thursday and the US Nonfarm Payrolls report for February on Friday.
On the economic data front, more negativeness for the US Dollar could be on the horizon. The Institute for Supply Management (ISM) is set to release its report on the Services sector on Wednesday. At the start of the week on Monday, the ISM report on the Manufacturing sector set in motion the correction in the Greenback, which only accelerated further since then.
Daily digest market movers: ADP misses
- At 13:15 GMT, the usual appetizer ahead of the Nonfarm Payrolls came in with the ADP Employment Change number for February. The number came in at 77,000, far below the xpectations for 140,000 new employees in the private sector, below the 183,000 in January.
- At 14:45 GMT, S&P Global will release its final reading for the Purchasing Managers Index (PMI) on the Services sector. Expectations are for a steady 49.7.
- At 15:00 GMT, the ISM is ready to release its PMI report on the Services sector for February:
- Services PMI is expected to come in at 52.6, a touch softer than the previous 52.8.
- The economic calendar does not show expectations regarding the Employment component, which was 52.3 in January.
- The New Orders component has no consensus view and was at 51.3 previously.
- At 18:00 GMT, Federal Reserve Bank of Richmond President Thomas Barkin delivers a speech titled “Inflation Then and Now” at the Fredericksburg Regional Alliance in Fredericksburg, United States.
- At 19:00 GMT, the Federal Reserve will release the Beige Book, which reports on the current US economic situation.
- Equities are on the rebound, with green spurts across the board from Asia over Europe and into the US futures.
- The CME Fedwatch Tool projects a 21.0% chance that interest rates will remain at the current range of 4.25%-4.50% in June, with the rest showing a possible rate cut.
- The US 10-year yield trades around 4.21%, off its near five-month low of 4.10% printed on Tuesday.
US Dollar Index Technical Analysis: Looking for the bottom
The US Dollar Index (DXY) is not enjoying this week, that is for sure. The DXY sees bulls exiting the premises, which gives the US Dollar bears good cards to run the Greenback into the ground. With more and more calls for lower US rates while US economic data further deteriorates, it looks like the DXY might be on its way even to 103.00 in the near term if this selling pressure keeps persisting.
On the upside, the first upside target to recover is the pivotal level at 105.53. Once through there, a heavy job awaits with pivotal levels at 105.89 and 106.52 before bulls start to consider a visit to the 100-day Simple Moving Average (SMA) at 106.87.
On the downside, the 200-day SMA at 105.03 is identified as the first support level, which is being tested at the time of writing. Should that level snap, a long stretch opens up towards 104.00. Even 103.00 could come under consideration in case US yields roll off further.
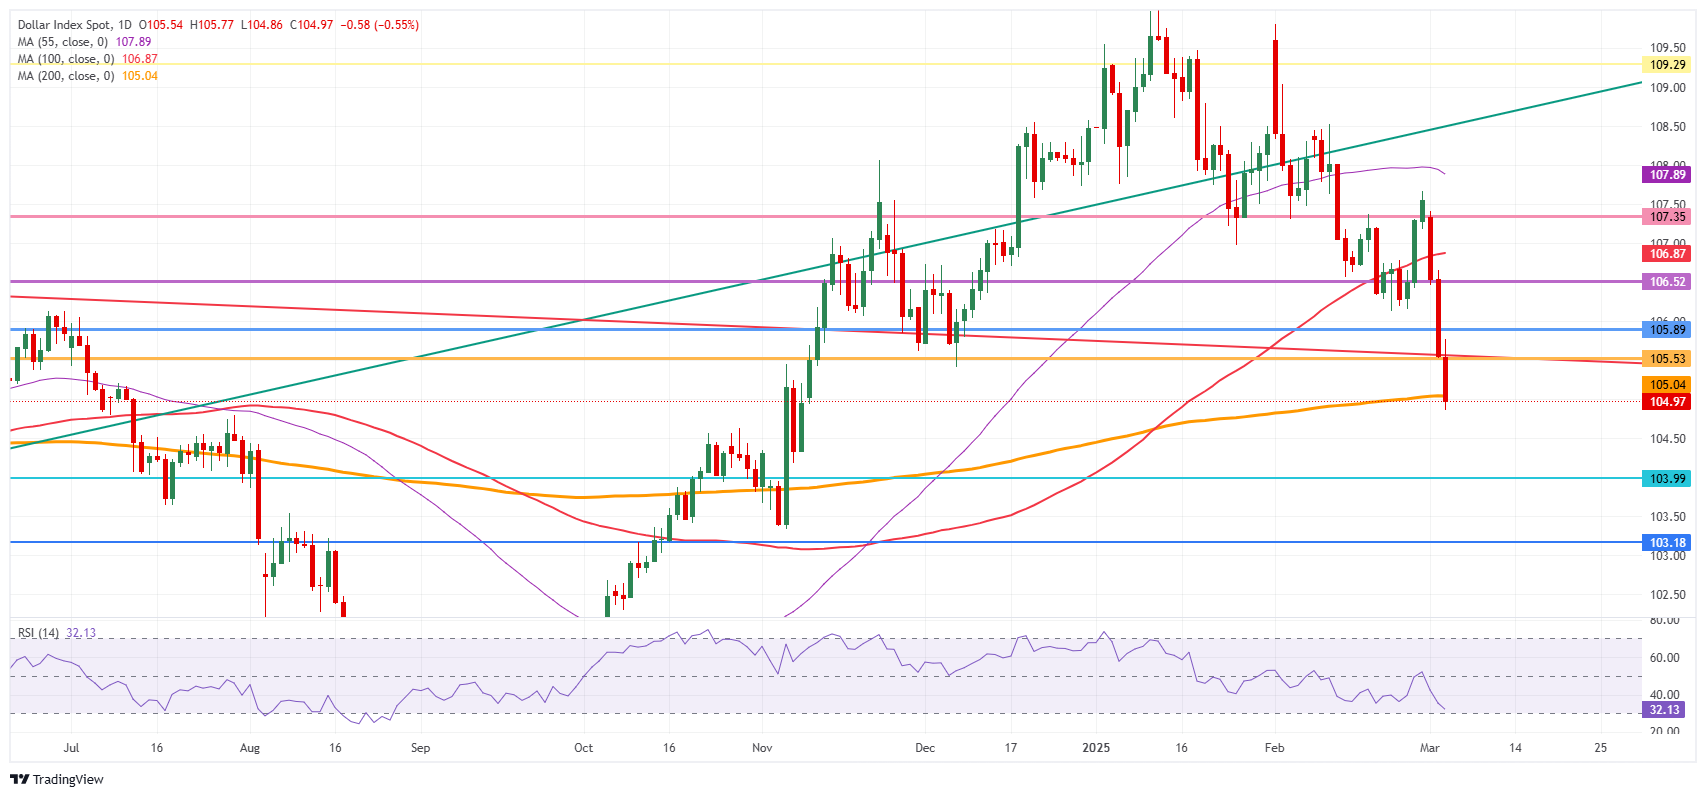
US Dollar Index: Daily Chart
US Dollar FAQs
The US Dollar (USD) is the official currency of the United States of America, and the ‘de facto’ currency of a significant number of other countries where it is found in circulation alongside local notes. It is the most heavily traded currency in the world, accounting for over 88% of all global foreign exchange turnover, or an average of $6.6 trillion in transactions per day, according to data from 2022. Following the second world war, the USD took over from the British Pound as the world’s reserve currency. For most of its history, the US Dollar was backed by Gold, until the Bretton Woods Agreement in 1971 when the Gold Standard went away.
The most important single factor impacting on the value of the US Dollar is monetary policy, which is shaped by the Federal Reserve (Fed). The Fed has two mandates: to achieve price stability (control inflation) and foster full employment. Its primary tool to achieve these two goals is by adjusting interest rates. When prices are rising too quickly and inflation is above the Fed’s 2% target, the Fed will raise rates, which helps the USD value. When inflation falls below 2% or the Unemployment Rate is too high, the Fed may lower interest rates, which weighs on the Greenback.
In extreme situations, the Federal Reserve can also print more Dollars and enact quantitative easing (QE). QE is the process by which the Fed substantially increases the flow of credit in a stuck financial system. It is a non-standard policy measure used when credit has dried up because banks will not lend to each other (out of the fear of counterparty default). It is a last resort when simply lowering interest rates is unlikely to achieve the necessary result. It was the Fed’s weapon of choice to combat the credit crunch that occurred during the Great Financial Crisis in 2008. It involves the Fed printing more Dollars and using them to buy US government bonds predominantly from financial institutions. QE usually leads to a weaker US Dollar.
Quantitative tightening (QT) is the reverse process whereby the Federal Reserve stops buying bonds from financial institutions and does not reinvest the principal from the bonds it holds maturing in new purchases. It is usually positive for the US Dollar.

