cemagraphics
The technicals on the S&P500 (SPY) sure pointed me in the wrong direction last week. After a highest ever monthly close in August combined with a highest ever weekly close and a bull flag on the daily chart, the conclusion had to be that the odds favoured a break higher (although I made the point it was likely to be laboured and slow given the bearish drivers in the backdrop).
That obviously didn’t happen and this week’s drop broke the 5500 inflection point which quickly led to the next support of 5390-400.
This week’s article will focus on targets for the decline and whether it alters the bigger picture view. Various techniques will be applied to multiple timeframes in a top-down process which also considers the major market drivers. The aim is to provide an actionable guide with directional bias, important levels, and expectations for future price action.
S&P 500 Monthly
The September bar made no attempt to test higher and the weak seasonality had an effect right from the first day of the month. As pointed out last week, Septembers during election years close higher only 50% of the time and average out at a -0.46% loss. In this sense, the current dip is perfectly normal for this time of year and is also influenced by the monthly Demark exhaustion signal.
Perhaps now is a good time to repeat the stats I last showed back in July.
A positive start to an election year has been an extremely positive omen for SPX. Out of the 16 previous years where it has had a positive return in the first half of the year, prices have been higher 100% of the time in the second half, including 5 years that had double-digit returns for H2.
H2 Returns (Matrixtrade)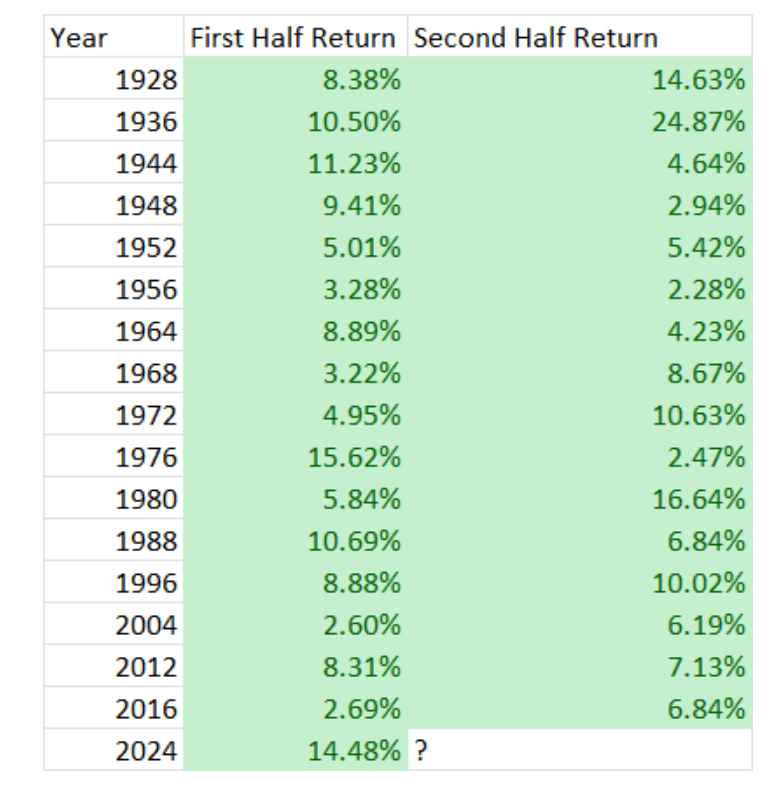
My impression of the monthly chart is the pattern is still bullish and the top is unlikely to be in. Weakness in September and October is often followed by a post-election rally to new highs.
SPX Monthly (Tradingview)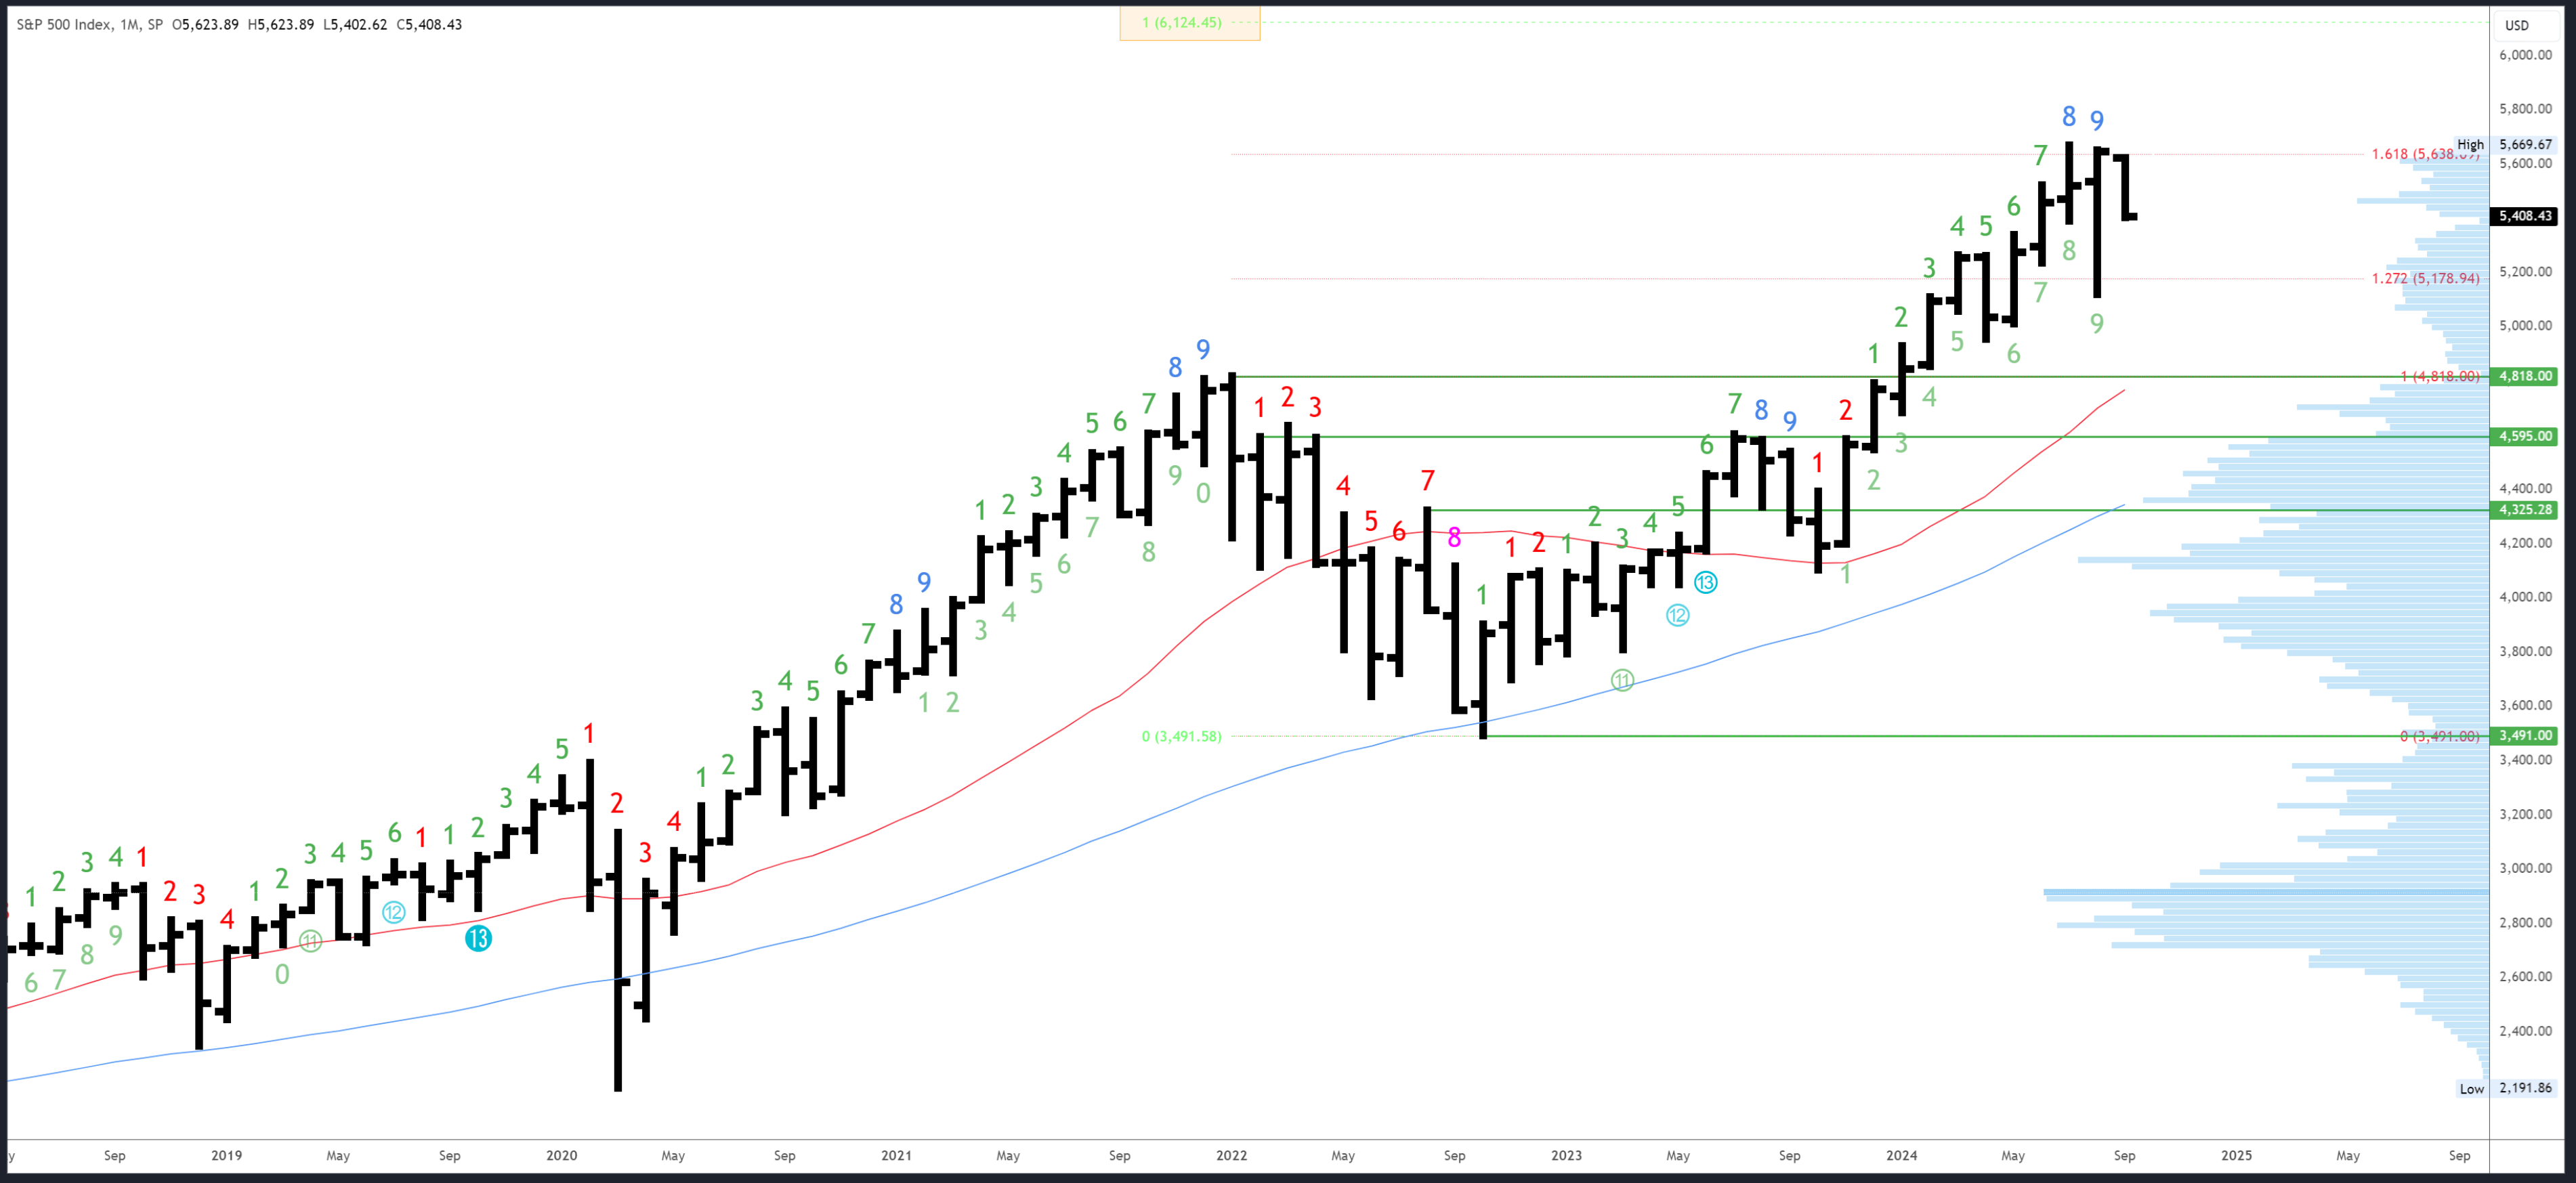
The 5669 top remains the obvious resistance point. Above that there is no major level until 6124, although the 5879 level might be relevant. This is the 161.8% Fibonacci extension of the 2022 bear market on the logarithmic chart.
5390 and the August low of 5119 are initial supports. 5265 at the March/April highs might also be relevant if there is confluence in the area from other timeframes.
The August bar completed the upside Demark exhaustion count and is clearly still having an effect.
S&P 500 Weekly
This week’s bar opened lower from an all-time high close the previous week. It was a sneaky move and trapped a few late bulls. Thankfully, I was not one of them and as I commented two weeks ago, “being bullish does mean buy at any price.” That said, I did try to buy the dip at 5500 so it wasn’t a great week.
In a similar vein to the monthly chart, the weekly pattern has not formed a high probability reversal pattern and is unlikely to mark a top.
The 20-week MA was tested at the weekly low. This is potential support, although the weak close suggests next week’s bar could test lower before any reversal. Indeed, it’s worth looking at what happened last time this MA was tested at the beginning of August – an initial test led to a small bounce and then a large drop through on the next bar. This all happened after the last NFP under similar circumstances.
SPX Weekly (Tradingview)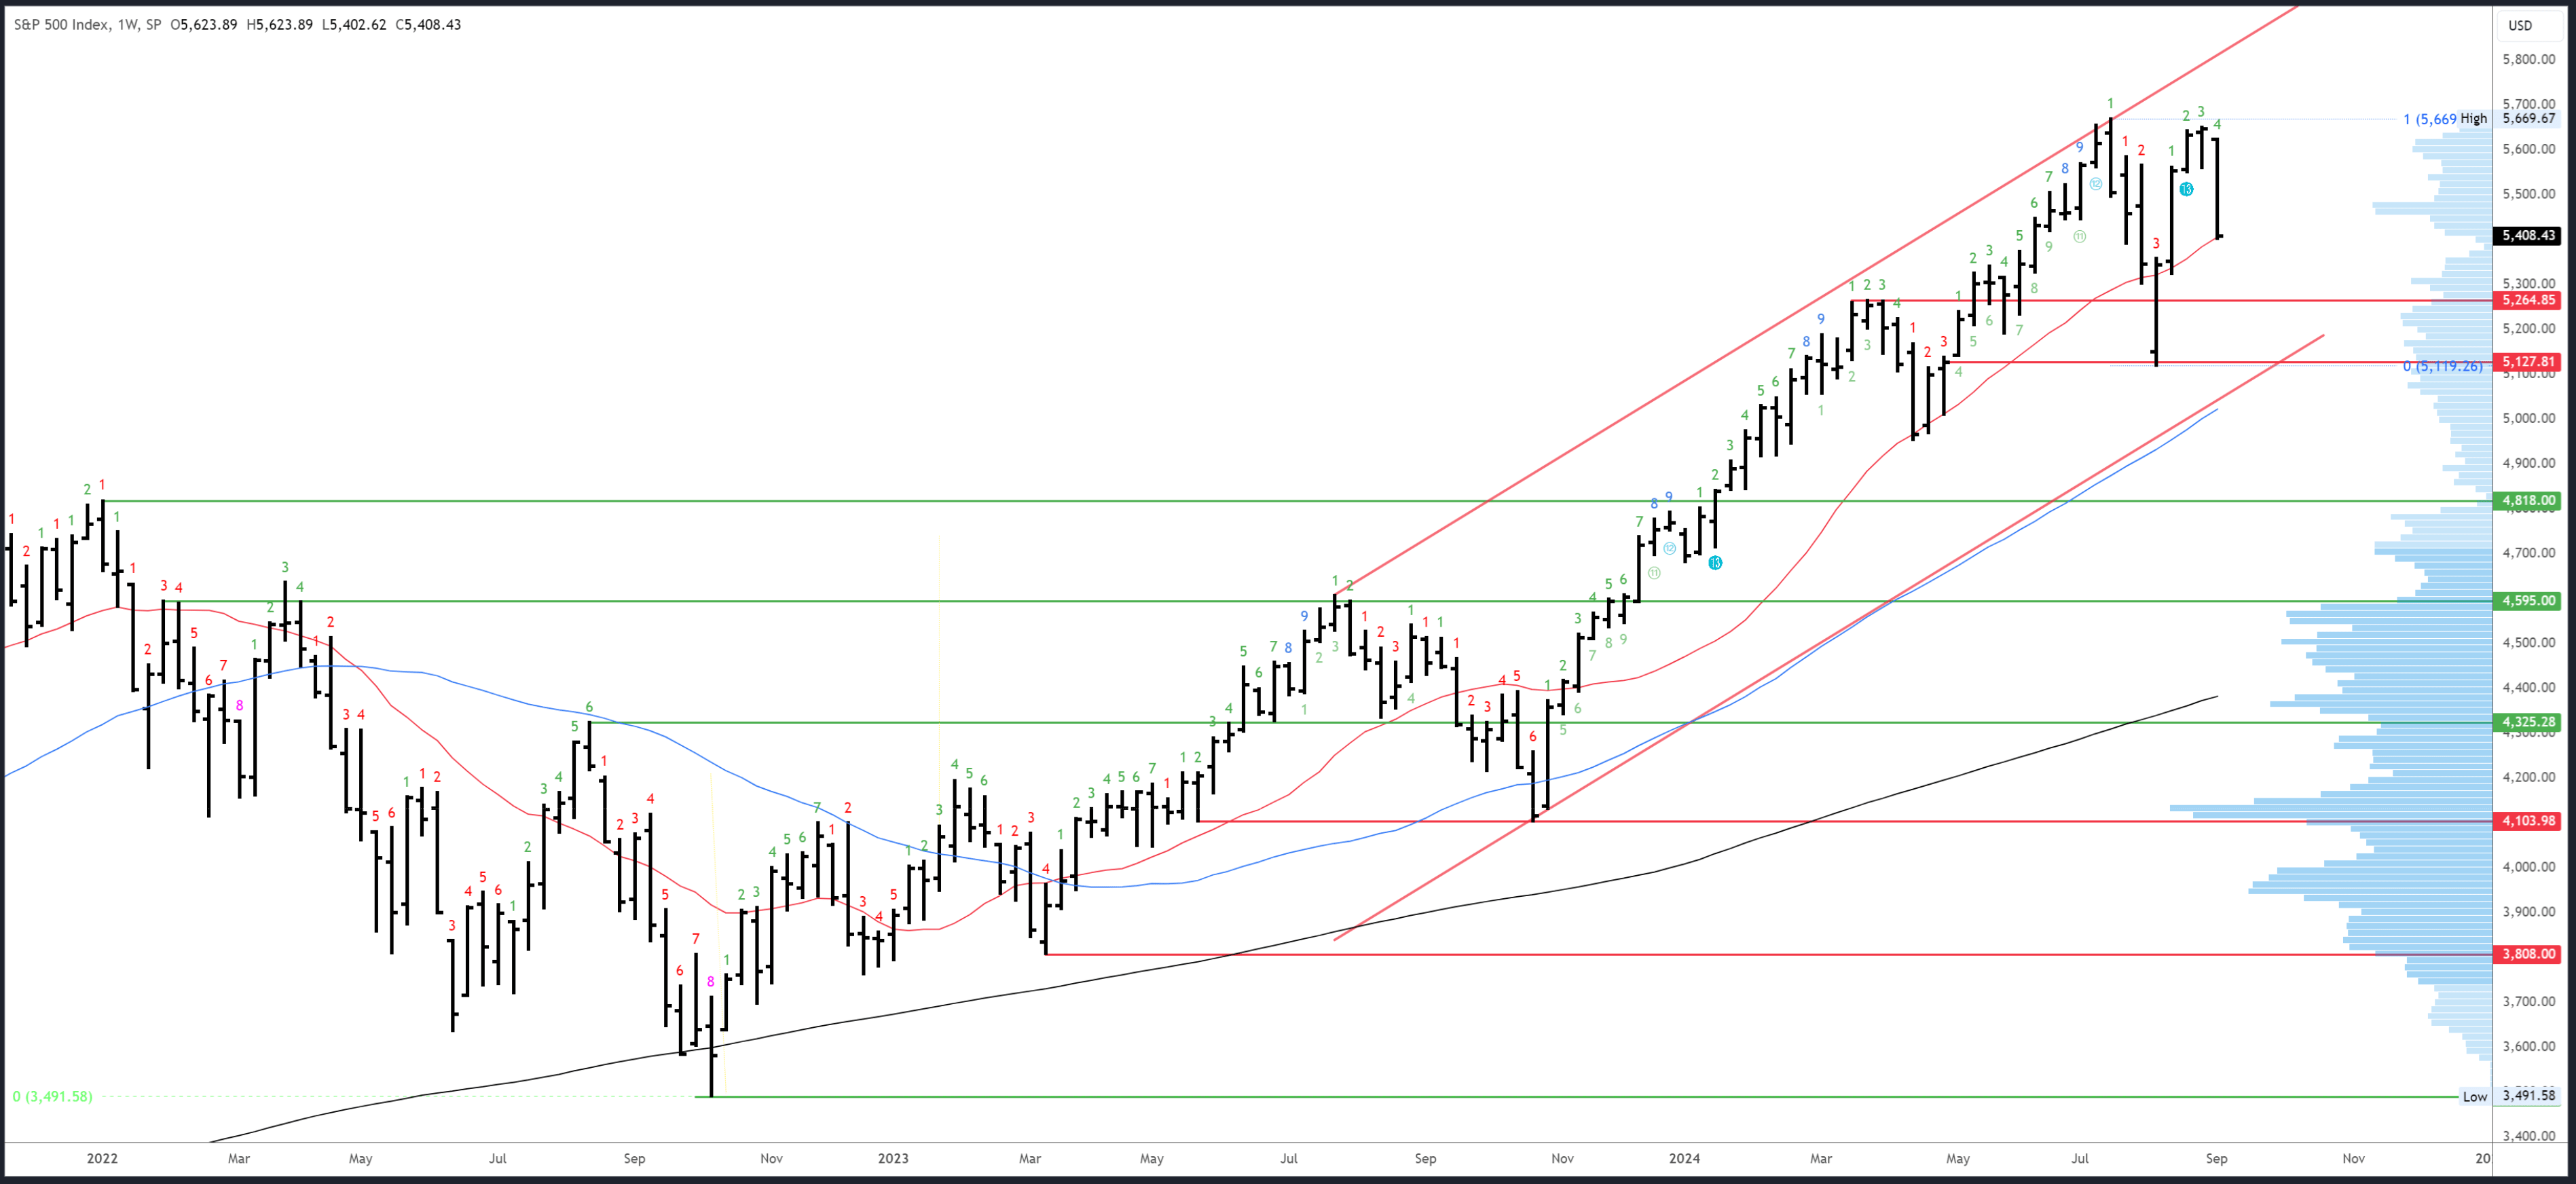
The gap at 5623-48 is the first resistance, then 5669. 6010 is the 161.8* Fibonacci extension of the July-August drop.
The 20-week MA is potential support but likely to be undercut. 5324-5358 is the next weekly support area. The channel low and 50-week MA may well catch up with price over the following weeks.
Next week will be bar 2 (of 9) in a new downside Demark count. The lack of a clear trend means new exhaustion signals are unlikely to proceed to completion.
S&P 500 Daily
5500 was the downside inflection highlighted in previous articles. This held for 3 sessions but then broke convincingly after NFP and the S&P500 dropped right to the next area at 5390-400. Given the prospect of a repeat of the August 5th crash, traders couldn’t get out quickly enough ahead of Friday’s close.
SPX Daily (Tradingview)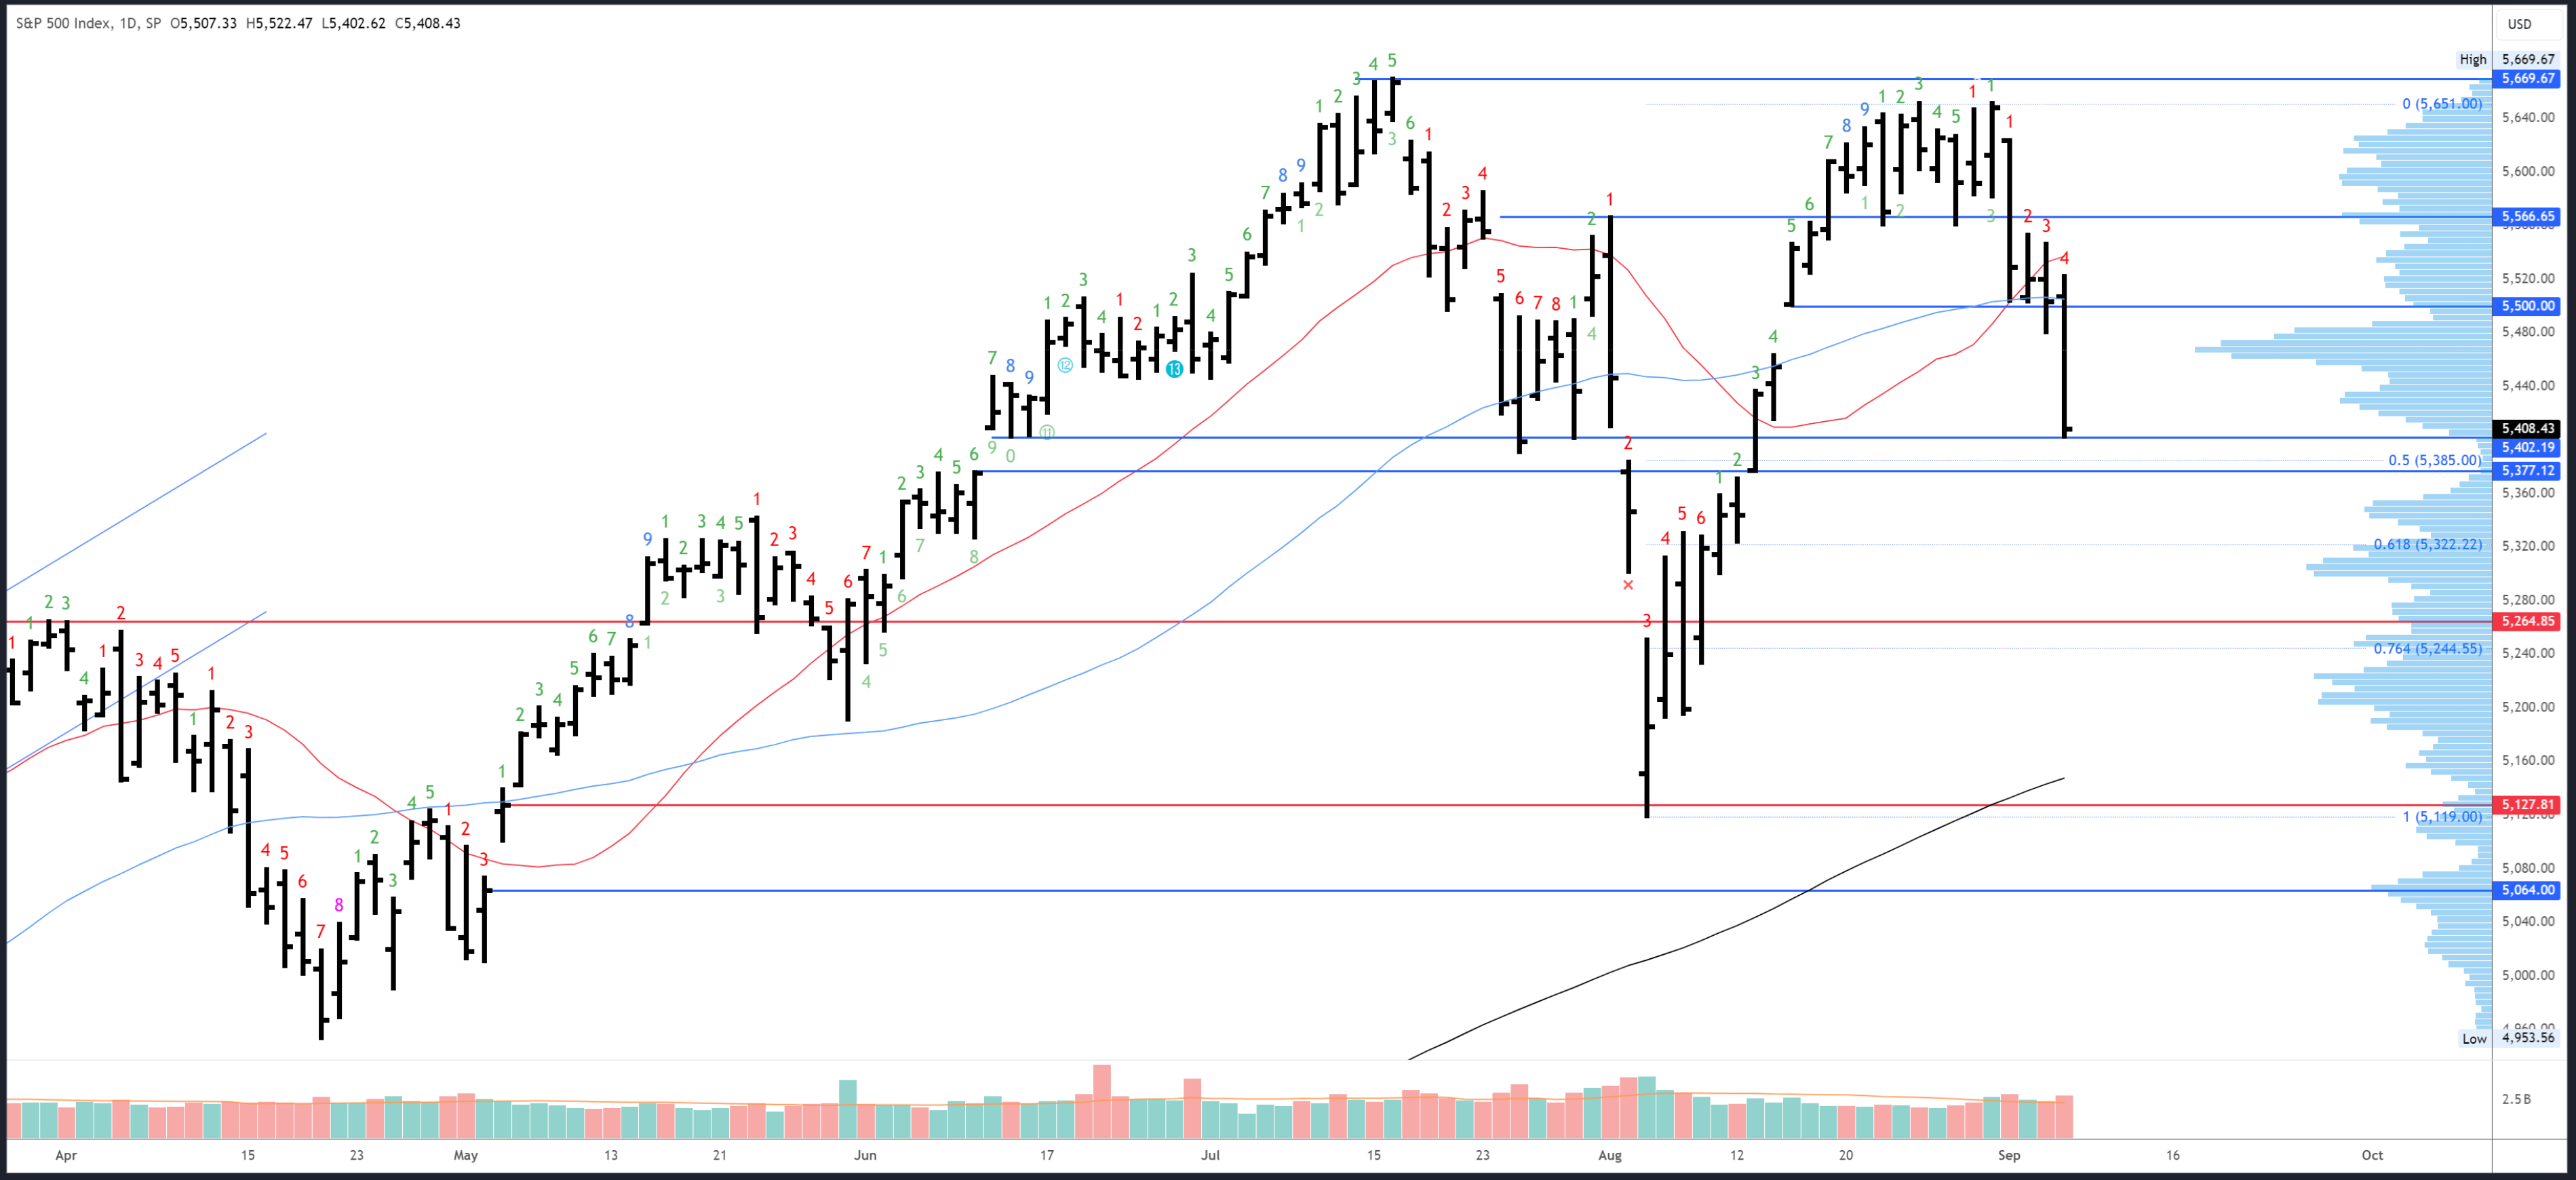
5500 will now act as resistance, as will 5550-60.
5377-400 is initial support and the 50% retrace at 5385 is right in that range. There are a few minor areas below, with 5322-24 at the 61% Fib retrace an area of interest, then 5265. I also see the 200dma creeping up to around the August low; perhaps this correction will test it after all.
A downside Demark exhaustion signal will be on bar 5 (of 9) on Monday. Reactions are often seen on bar 8 onwards so that means we could see a bounce/pause on Thursday / Friday.
Drivers/Events
Friday’s headline NFP number of +142 missed estimates slightly but was up on last month’s +89K reading (which was revised lower). Crucially, the unemployment rate dropped from 4.3% to 4.2% and this likely means the Fed will cut 25bps instead of 50bps at the September meeting. Indeed, the odds of a 25bps move rose from 55% ahead of the Jobs Report to 70% at the close. Without panic over the labour market, a 50bps cut could be perceived as too political ahead of the election and may cause concern the Fed is behind the curve.
Given the improvement in the data, long-term yields and the USD stayed relatively steady. The weakness in stocks could therefore be seen as an overreaction to the data, and was probably more a flee to safety ahead of the weekend. With the BoJ submitting a document outlining its intentions to continue hiking if needs-be, the similarities with carry trade unwind and the August 5th crash were concerning.
The Fed are now in a blackout period ahead of the September meeting and next week’s data will be thin, with only CPI on Wednesday worth mentioning. Inflation is now secondary to the labour market so the release may not be such a major driver. Only a massive upside beat would cause concern and make the easing cycle a lot more complicated than it currently looks.
Probable Moves Next Week(s)
Despite the large bearish swing lower this week, the bigger picture view remains bullish and a break to new all-time highs is still expected. This may take some time to set up, and with both September and October expected to be weak, a further drop and more consolidation could be needed to set up a post-election rally. The general path may well be similar to last year as a correction from July into late October sets up a surge higher in November and December.
Nearer-term, the break of 5500 confirms a new phase lower is underway and this could eventually get near the August low of 5119 to test the 200dma. The swing down likely comprises of two smaller legs and the first of these could complete next week with a new low in the 5377 area leading to a bounce slightly above 5500.
While a repeat of the August 5th crash is a concern, the Jobs Report was not as shocking this time and the market should be more prepared (and liquid). Any further weakness on Monday is likely short-lived and should lead to a short-term reversal as Friday’s sellers re-buy with weekend risk in the rear mirror.