
Urupong
Fourth Quarter 2024 Performance Summary
|
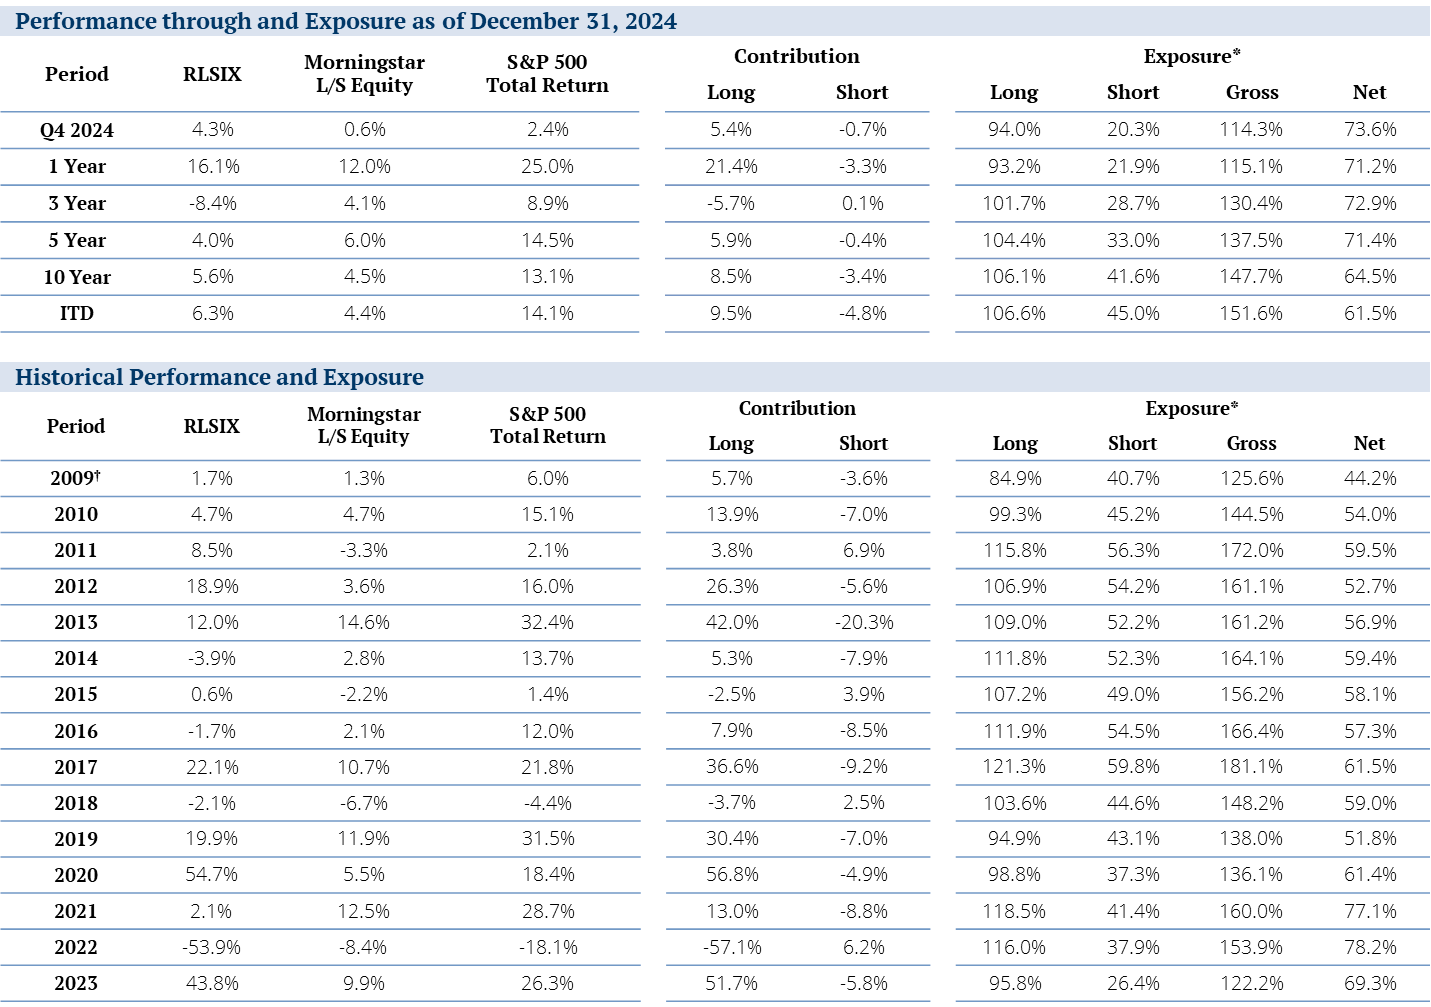
Performance: Net Returns as of December 31, 2024 |
||||||
|
Current Quarter |
One Year |
Three Year |
Five Year |
Ten Year |
Since Inception |
|
|
Institutional Shares (RLSIX) |
4.32% |
16.06% |
-8.35% |
3.99% |
5.59% |
6.31% |
|
Retail Shares (RLSFX) |
4.26% |
15.85% |
-8.51% |
3.77% |
5.38% |
6.14% |
|
Morningstar L/S Equity Category |
0.57% |
12.01% |
4.11% |
6.04% |
4.46% |
4.43% |
|
S&P 500 Total Return Index |
2.41% |
25.02% |
8.94% |
14.53% |
13.10% |
14.06% |
|
Annualized performance since inception of the Mutual Fund (3/30/2012) was 4.81% for RLSIX and 4.61% for RLSFX. The performance quoted for periods prior to March 30, 2012 is that of RiverPark Opportunity Fund, LLC (the “Predecessor Fund”). The inception date of the Predecessor Fund was September 30, 2009. The performance of the Predecessor Fund includes the deduction of actual fees and expenses, which were higher than the fees and expenses charged to the Fund. Although the Fund is managed in a materially equivalent manner to its predecessor, the Predecessor Fund was not a registered mutual fund and was not subject to the same investment and tax restrictions as the Fund. Performance shown for periods greater than one year are annualized. Index performance returns do not reflect any management fees, transaction costs, or expenses. Indexes are unmanaged and one cannot invest directly in an Index. Morningstar L/S Equity Category Returns sourced from Morningstar Principia. The performance quoted herein represents past performance. Past performance does not guarantee future results. The investment return and principal value of an investment will fluctuate so that an investor’s shares, when redeemed, may be worth more or less than their original cost, and current performance may be higher or lower than the performance quoted. For performance data current to the most recent month end, please call 888.564.4517. Expense Ratio: Institutional: 1.89% gross and 1.85% net, Retail: 2.14% gross and 2.00% net as of the most recent prospectus, dated January 26, 2024. Gross Expense Ratio does not reflect the ability of the adviser to recover all or a portion of prior waivers, which would result in higher expenses for the investor. Please reference the prospectus for additional information. |
In the fourth quarter of 2024, the S&P 500 Index (SP500, SPX) continued its upward trajectory, gaining approximately 2.4% and surpassing the 6,000 mark for the first time in early December. This milestone contributed to an impressive annual return of 25% for the index. The RiverPark Long/Short Opportunity Fund also performed well in the quarter and year, rising 4.3% and 16.1% respectively.
The robust performance was largely driven by significant gains in major technology stocks, particularly those involved in artificial intelligence. However, the rally was somewhat concentrated, with the “Magnificent Seven” tech giants—Alphabet (GOOG,GOOGL), Amazon (AMZN), Apple (AAPL), META, Microsoft (MSFT), Nvidia (NVDA), and Tesla (TSLA)—accounting for more than 100% of the S&P 500’s return in the fourth quarter, indicating that the other 493 stocks collectively experienced a slight decline.
Despite the overall positive trend, rising bond yields towards the end of the quarter began to exert pressure on equity markets, introducing increased volatility as the year concluded.
Overall, our longs contributed 5.4% and our shorts hurt us by -0.7%.
In the short book, we continue to focus on businesses that we believe are losing competitive market share, that have business models we believe are flawed or are facing cyclical headwinds (including unprofitable technology, subscale internet media, residential real estate, cyclical industrial and consumer lending). In addition, we use select ETFs from time to time to manage exposure.
We started the third quarter 93.7% long, 26.5% short, and 67.2% net. We ended the quarter with less gross exposure and more net exposure at 92.9% long, 15.7% short, and 77.2% net.
Below we describe some of our top and bottom performers.
Portfolio Review
Top Contributors
|
Top Contributors to Performance for the Quarter Ended December 31, 2024 |
Percent Impact |
|
Shopify Inc. (SHOP, long) |
0.79% |
|
Nvidia Corporation (long) |
0.78% |
|
Amazon.com, Inc. (long) |
0.75% |
|
Portfolio Attribution is produced by RiverPark Advisors, LLC (RiverPark), the Fund’s adviser. Although RiverPark believes that its attribution methodology adheres to generally accepted standards in the industry, attribution analysis is not an exact science and different methodologies may produce different results. Performance Attribution is shown gross of fees. Holdings are subject to change. |
Shopify: Shopify was our top contributor in the fourth quarter following a strong 3Q earnings report that included better than expected revenue growth and continued margin expansion. GMV growth of 24% was three percentage points above investor estimates, revenue of $2.2 billion was $40 million better and free cash flow of $421 million was $80 million better. A combination of new merchants to the company’s platform, increased adoption of SHOP’s offerings by existing merchants, and e-commerce market share gains are driving this revenue growth and profitability.
In 2023, 10% of US retail e-commerce sales flowed through SHOP, second only to Amazon, and the company is still enjoying significant tailwinds as retail merchants of all sizes adopt SHOP’s software tools to display, manage and sell their products across a dozen different sales channels. We believe that the overall growth of e-commerce, combined with the development of new products and services, such as its digital wallet Shop Pay, should continue to drive revenue growth of more than 20% per year over the next several years, accompanied by re-acceleration of operating margin growth and FCF generation.
Nvidia: NVDA was a top contributor in the fourth quarter following blowout 1Q results and guidance driven by strong data center sales (+427% year-over-year). The company reported revenue of $26 billion, up 262% year-over-year, and EPS of $6.12, up 462% year-over-year and 9% ahead of expectations. Revenue guidance for 2Q of $28 billion was 5% above very high expectations. The artificial intelligence arms race, kicked off by ChatGPT and Alphabet’s Bard, among others, has generated tremendous demand for Nvidia’s next generation graphic processors.
NVDA is the leading designer of graphics processing units (GPU’s) required for powerful computer processing. Over the past 20 years, the company has evolved through innovation and adaptation from a predominantly gaming-focused chip vendor to one of the largest semiconductor/software vendors in the world. Over the past decade, the company has grown revenue at a compound annual rate of over 20% while expanding operating margins and, through its asset light business model, producing ever increasing amounts of free cash flow. Following recent results, Jensen Huang, founder and CEO of Nvidia stated in the company’s press release, “a trillion dollars of installed global data center infrastructure will transition from general purpose to accelerated computing as companies race to apply generative AI into every product, service and business process.”
Amazon: Amazon was a top contributor in the fourth quarter following third quarter results of slightly better than expected revenue and much stronger than expected operating income. 3Q operating income of $17.4 billion exceeded company guidance of $11.5-15 billion (and Street estimates of $14.7 billion), driven by margin expansion across all three major segments, including gross/net margins of 38% at AWS, up from 30%. In addition, the company reported an acceleration in e-commerce demand both domestically and internationally, and accelerated growth of Prime paid memberships. The company guided to 4Q operating income of roughly $18 billion driven by the same positive factors that impacted 3Q.
With its ability to continue its market share gains in its three leading businesses (e-commerce, web services and online advertising), plus a multi-year operating margin expansion opportunity (from improved e-commerce margins and greater contribution from the faster growing, higher margin AWS and advertising segments), we believe Amazon remains one of the best-positioned global growth companies in the world.
Top Detractors
|
Top Detractors From Performance for the Quarter Ended December 31, 2024 |
Percent Impact |
|
|
Uber Technologies (UBER, long) |
-0.69% |
|
|
Eli Lilly and Company (LLY, long) |
-0.32% |
|
|
iShares Expanded Tech-Software Sector ETF (IGV, short) |
-0.30% |
|
Portfolio Attribution is produced by RiverPark Advisors, LLC (RiverPark), the Fund’s adviser. Although RiverPark believes that its attribution methodology adheres to generally accepted standards in the industry, attribution analysis is not an exact science and different methodologies may produce different results. Performance Attribution is shown gross of fees. Holdings are subject to change. |
Uber Technologies: Uber was our top detractor in the fourth quarter after reporting what we perceived to be a strong 3Q24. The company reported gross bookings of $40.9 billion were up 16% year-over-year (20% in constant currency). Mobility gross bookings of $21.0 billion grew 17% over last year (24% in constant currency) driven by a combination of product innovation and driver availability. Delivery gross bookings of $18.7 billion were up 16% from last year (17% in constant currency) and continued to be strong throughout the quarter. 4Q Adjusted EBITDA of $1.7 billion, up $598 million year-over-year, was better than management’s guidance of $1.6 billion, and the company generated $2.1 billion of free cash flow, up from $905 million last year. Management guided to continuing growth in 1Q Gross Bookings (18% growth) and Adjusted EBITDA (of $1.8 billion). Despite these strong operating metrics, the stock was pressured throughout the quarter by fears of autonomous cars (RoboTaxis) potentially taking ride share market share in the coming decade.
UBER remains the undisputed global leader in ride sharing, with a greater than 50% share in every major region in which it operates. The company is also a leader in food delivery, where it is number one or two in the more than 25 countries in which it operates. Moreover, after a history of losses, the company is now profitable, delivering expanding margins and substantial free cash flow. We view UBER as more than a ride sharing and food delivery service; we also see it as a global mobility platform with 161 million users (by comparison, Amazon Prime is thought to have 200 million members) and the ability to penetrate new markets of on-demand services, such as package and grocery delivery, travel, and hourly worker staffing. Given its $9 billion of unrestricted cash and $7.9 billion of investments, the company today has an enterprise value of $130 billion, indicating that UBER trades at 16x and 12x our estimates of 2025 and 2026 free cash flow respectively.
Eli Lilly: LLY was a top detractor in the fourth quarter following a rare revenue miss in the company’s 3Q update. The greater than $1 billion miss in the tirzepatide complex (Mounjaro/Zepbound) was caused by a combination of factors, including wholesaler stocking patterns (2Q inventory build, 3Q sell through), refrigerated supply chain constraints, timing of the company’s direct-to-consumer efforts, and the pace of international market launches. We believe the diabetes/obesity/weight-loss market is enormous and that current GLP-1 drugs, though no longer supply constrained, are greatly in demand. We are confident that LLY’s recent sales shortfall was supply chain-related and that the company’s tirzepatide franchise growth will soon reaccelerate.
LLY discovers, develops, manufactures, and markets pharmaceutical products. The company manufactures and distributes products through facilities in the United States and seven other countries and sells into 110 countries. The company has a broad and deep portfolio of products including a focus on diabetes, oncology, immunology and neuroscience. More recently, LLY’s GLP-1 diabetes drug Mounjaro and obesity drug Zepbound, have delivered strong revenue growth, and investors are optimistic that the company’s recently approved Alzheimer drug, Kisunla, will add to that growth.
LLY has a stable portfolio of franchise products, which enables it to invest heavily in its product pipeline. We believe that this combination of franchise and growth products will drive high teens revenue growth and a four-fold increase in free cash flow in the next five years.
iShares Expanded Tech-Software Sector ETF (IGV): Our short of IGV, an ETF comprised of 123 North American software companies, was a top detractor in the quarter. Our short was a hedge for our substantial software positions against a sharp decline in the technology sector, and software in particular, related to a potential economic slowdown and/or inflation related rate increases.
Top Ten Long Holdings
Below is a list of our top ten long holdings as of the end of the quarter:
|
Holdings |
Percent of Net Assets |
|
Microsoft Corp. |
6.6% |
|
Nvidia Corp. |
6.4% |
|
Apple Inc. |
6.4% |
|
Alphabet Inc. |
4.9% |
|
Amazon.com, Inc. |
4.7% |
|
Meta Platforms, Inc. |
4.2% |
|
Uber Technologies, Inc. |
3.4% |
|
Netflix, Inc. |
3.0% |
|
Shopify Inc. |
2.8% |
|
Mastercard Inc. |
2.7% |
|
45.0% |
|
|
Holdings subject to change. |
Below is a list of the key secular themes represented on both sides of our portfolio as of the end of the quarter.
|
Long Portfolio Themes |
Short Portfolio Themes |
|||
|
AI/Cloud Computing |
16.7% |
Cyclical Industrial |
3.1% | |
|
Internet Media |
11.4% |
European Equities |
2.6% | |
|
E-Commerce |
7.5% |
Consumer Lending |
2.3% | |
|
Mobile Compute |
6.4% |
Residential Real Estate |
1.9% | |
|
Content Streaming |
5.7% |
Travel and Leisure |
1.3% | |
|
Payments |
5.2% |
Food Delivery |
0.8% | |
|
Alternative Asset Managers |
5.2% |
Online Travel Agency |
0.7% | |
|
Application Software |
5.1% |
Health Clubs |
0.6% | |
|
Rides/Delivery |
4.1% |
Alternative Asset Managers |
0.6% | |
|
Healthcare Technology |
3.5% |
Flawed Technology |
0.6% |
|
This is a representative (non-exhaustive) list of our largest current long and short themes. Holdings subject to change. |
Summary
We continue to believe that our secular-themed long/short portfolio is well positioned to generate strong absolute and relative performance in the years to come. We will continue to keep you apprised of our process and portfolio holdings in these letters each quarter. As always, please do not hesitate to contact us if you have any questions or comments about anything we have written or about any of our funds.
We thank you for your interest in the RiverPark Long/Short Opportunity Fund.
Sincerely,
Conrad van Tienhoven | Portfolio Manager
|
† Inception date of the Fund was September 30, 2009. Annualized performance since inception of the Mutual Fund (3/30/12) was 4.8% for RLSIX. The performance quoted herein represents past performance. Past performance does not guarantee future results. The performance quoted for periods prior to March 30, 2012 is that of RiverPark Opportunity Fund, LLC (the “Predecessor Fund”). The inception date of the Predecessor Fund was September 30, 2009. The performance of the Predecessor Fund includes the deduction of actual fees and expenses, which were higher than the fees and expenses charged to the Fund. Although the Fund is managed in a materially equivalent manner to its predecessor, the Predecessor Fund was not a registered mutual fund and was not subject to the same investment and tax restrictions as the Fund. Performance shown for periods greater than one year are annualized. The Contribution numbers set forth above are produced by RiverPark Advisors, LLC, the Fund’s adviser, in accordance with generally accepted standards in the industry. Contribution is shown gross of management fees and expenses and is geometrically linked on a monthly basis. Contribution is not an exact science and different methodologies may produce different results. * Where applicable, the exposures are delta-adjusted and are computed by averaging the exposures of each month-end within each period. To determine if the Fund is an appropriate investment for you, carefully consider the Fund’s investment objectives, risk factors, charges, and expenses before investing. This and other information may be found in the Fund’s summary or full prospectus, which may be obtained by calling 888.564.4517, or by visiting the website at RiverPark Funds. Please read the prospectus carefully before investing. Mutual fund investing involves risk including possible loss of principal. In addition to the normal risks associated with investing, international investments may involve risk of capital loss from unfavorable fluctuation in currency values, from differences in generally accepted accounting principles or from social, economic or political instability in other nations. The use of leverage may accelerate the velocity of potential losses. Furthermore, the risk of loss from a short sale is unlimited because the Fund must purchase the shorted security at a higher price to complete the transaction and there is no upper limit for the security price. The use of options, swaps and derivatives by the Fund has the potential to increase significantly the Fund’s volatility. There can be no assurance that the Fund will achieve its stated objectives. This material represents the portfolio manager’s opinion and is an assessment of the market environment at a specific time and is not intended to be a forecast of future events or a guarantee of future results. This information should not be relied upon by the reader as research or investment advice regarding the funds or any security in particular. Standard and Poor’s 500 Total Return Index is a capitalization-weighted index of 500 stocks. The index is designed to measure performance of the broad domestic economy through changes in the aggregate market value of 500 stocks representing all major industries. Morningstar Long/Short Equity Category portfolios hold sizeable stakes in both long and short positions in equities and related derivatives. Some funds that fall into this category will shift their exposure to long and short positions depending on their macro outlook or the opportunities they uncover through bottom- up research. Some funds may simply hedge long stock positions through exchange-traded funds or derivatives. The Russell 1000 Growth Total Return Index measures the performance of those Russell 1000 companies with higher price-to-book ratios and higher forecasted growth values. The S&P 500 Total Return Index is an unmanaged capitalization-weighted index generally representative of large companies in the U.S. stock market and based on price changes and reinvested dividends. Morningstar Large Growth portfolios invest primarily in big U.S. companies that are projected to grow faster than other large-cap stocks. Index returns are for illustrative purposes only and do not reflect any management fees, transaction costs, or expenses. Indexes are unmanaged and one cannot invest directly in an Index. The RiverPark funds are distributed by SEI Investments Distribution Co., One Freedom Valley Drive, Oaks, PA 19456 which is not affiliated with RiverPark Advisors, LLC or their affiliates. |
Editor’s Note: The summary bullets for this article were chosen by Seeking Alpha editors.
Editor’s Note: This article covers one or more microcap stocks. Please be aware of the risks associated with these stocks.

