
danielvfung
Introduction
The J.P. Morgan Nasdaq Equity Premium Income ETF (NASDAQ:JEPQ) is a fund I’ve covered before here on Seeking Alpha, back in November of last year.
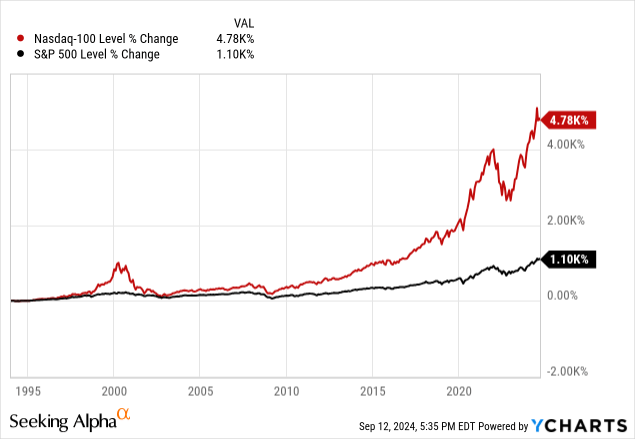
The fund itself is a covered-call ETF, meaning that it buys stocks and sells call options against them for income. In JEPQ’s case, it buys some of the components of the NASDAQ 100-Index (NDX) and sells calls against the index itself. More on that “some of” later in the holdings section. Very famously, the Nasdaq-100 has outperformed the S&P 500 in the last few decades, which has made it a target for funds like JEPQ to hold and write options against.
In November, I issued JEPQ a hold rating. It has performed well, but underperformed the broader market since my call.
Seeking Alpha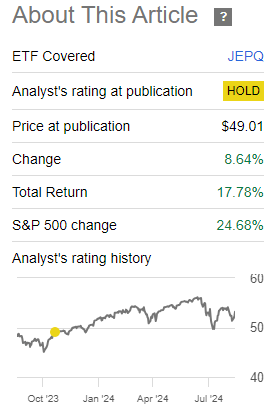
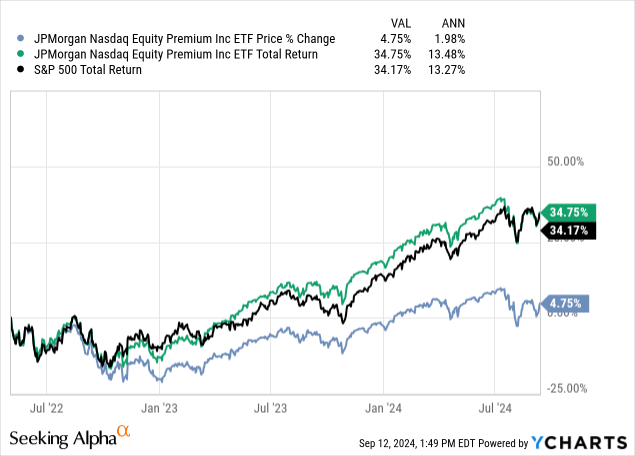
That being said, since inception, it has basically matched the market in total return. Note that most of JEPQ’s returns are from distributions, while SPX’s returns are mostly price appreciation. This has led to a large gap between the price return and total return.
Novice investors beware that neither price, nor total return metrics tell the whole story. It’s important to see both when using them to evaluate performance.
Return Decomposition
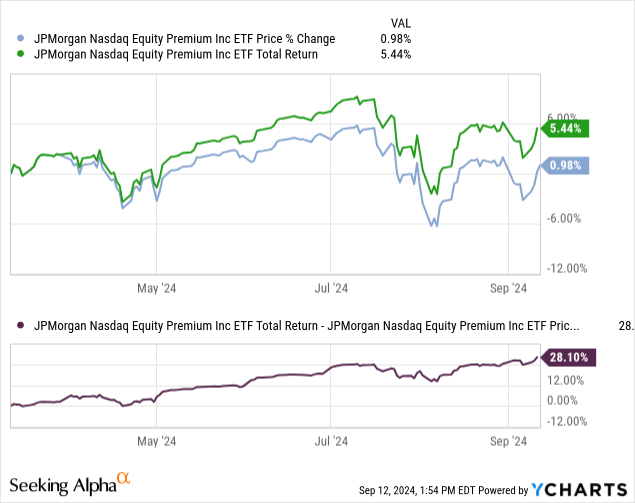
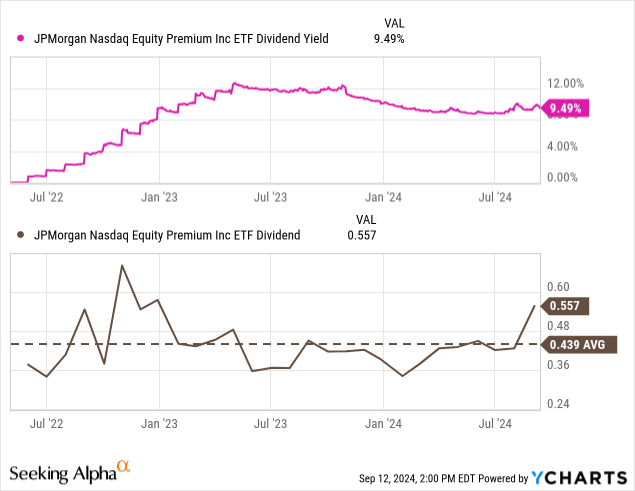
That gap between the price and total return is only widening, as the price has been stagnant for the last six months, but returns are up 5%. We can see that, in those six months, there has been a 28% widening in the total return/price gap.
Dividends are paid out monthly, in cash returns, and have been mostly in the same range for a while. There are a few anomalies, like last month, but for the most part, investors can expect an average of $0.45/share monthly.
Holdings
JEPQ’s holdings are essentially the same as the NASDAQ-100’s (NDX), with some changes made by management. JPMorgan gives the manager’s short bio on their site.
Lead Portfolio Manager Hamilton Reiner has over three decades of experience investing in equities and equity derivatives.
So what has Mr. Reiner done with the portfolio?
Differences From the Index
By weight, there’s an almost 70% overlap with the Invesco QQQ Trust ETF (QQQ), which is a passive index fund that can act as a benchmark for the weightings of NDX for our purposes here.
As you can see, there is some shifting of weights around the top names, but not by too much. It is mostly a reduction in concentration from QQQ.
ETFRC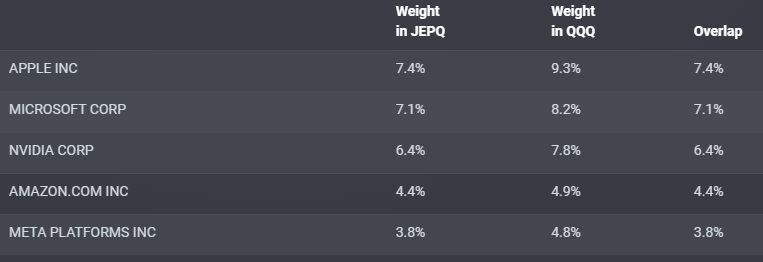
Exposure all around has been reduced, especially in tech. This, in my opinion, is a positive, as tech is the most overvalued sector currently. This change should help JEPQ weather down markets better.
ETFRC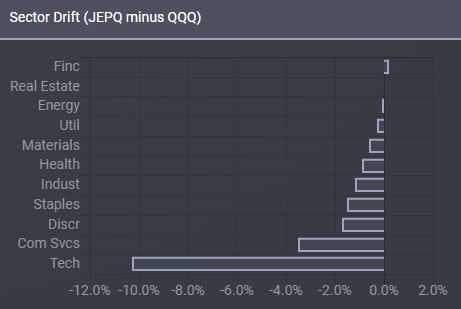
The changes also include the exclusion of dual-class stocks, so while QQQ owns both GOOGL and GOOG, JEPQ only owns one. Management also added in some other companies like Eaton Corp and Seagate at higher weights.
ETFRC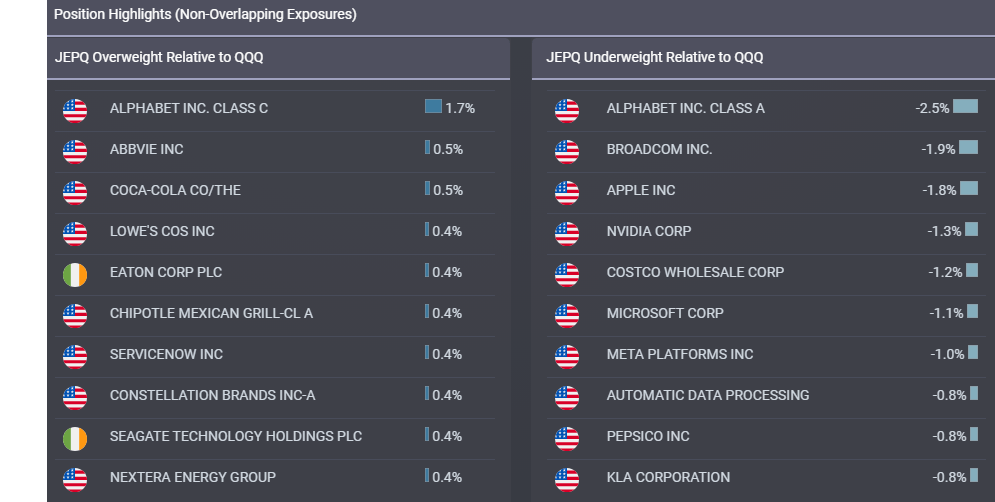
Ultimately, I like the changes because I believe they add to the fund’s stability and resilience to volatility. This is a very important consideration for investors, especially income investors who are willing to take on the equity risk. Anything you can do to reduce that risk while maintaining the strong 9%+ yield is worthwhile doing.
Major Advantage Over QQQ: Less Risk
We’ve seen JEPQ’s resilience demonstrated in how it handles drawdowns compared to QQQ. Note that when we see QQQ drawdowns in the emerald line below, the tangerine line follows, but is almost always more shallow.
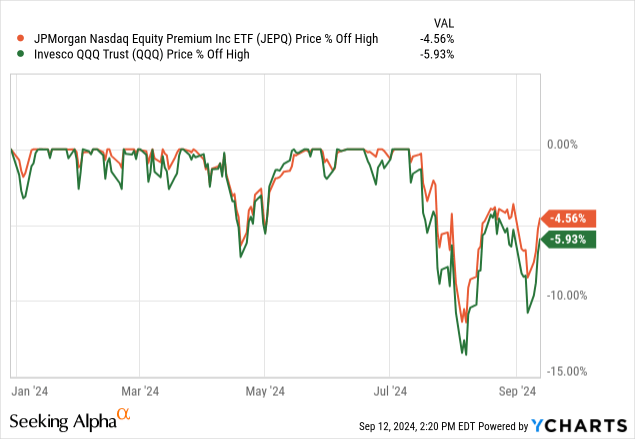
This is exactly what we are looking for in an options income fund, since its options are actually protecting the fund’s downside. The fund also is geared toward being less volatile by orienting further to value over growth, adding in the previously mentioned ex-US stocks, and by holding some treasuries to collateralize sold call options.
Portfolio Visualizer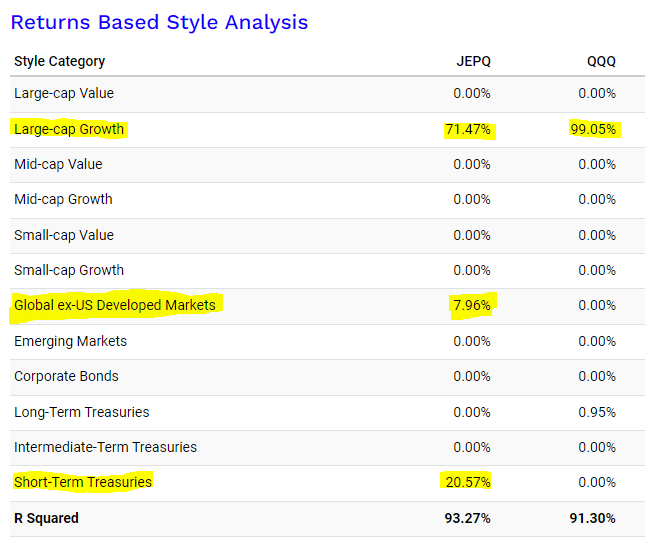
Since inception, when compared to the index, we’ve seen JEPQ exhibit a lower standard deviation and maximum drawdown.
Note: The next two charts include reinvested dividends at a time of distribution.
Portfolio Visualizer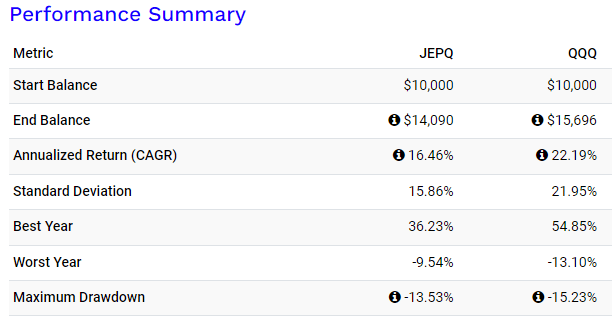
This has resulted in JEPQ underperforming QQQ’s best year since JEPQ’s inception, 2023, but also outperformed QQQ’s worst year.
Portfolio Visualizer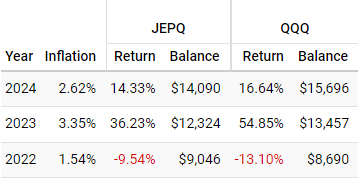
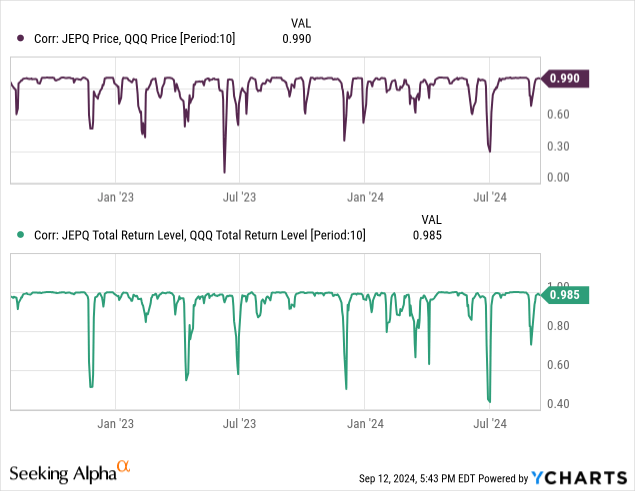
We can reasonably expect this relationship to continue so long as JEPQ doesn’t change its methodology. Since JEPQ doesn’t publish its strike or stock picking methodology, it’s impossible for us to tell unless something material in the fund changes. However, we can use corollary metrics to evaluate JEPQ’s performance against NDX. If it begins to stray off too far, then we know the changes have become “material.”
Risks Still Aplenty
While I believe that JEPQ presents less risk than holding the index on its own, it still carries significant risks. It is still full of equity risk, and while it will likely have less severe drawdowns than QQQ in the event of a crash, it will not be safe from the crash itself.
The other major issue is active management. Because the methodology behind choosing the fund’s composition and strikes for call options is proprietary and opaque, it is impossible for us to forecast JEPQ’s performance. So far, I believe that management has done a good job achieving the fund’s goals, but managers may change or rotate in the future to JEPQ’s disadvantage.
Underperformance is also a risk most will want to consider. While there JEPQ seems to offer less risk, the past shows us that it also seems to offer less reward. Passive indices have matched JEPQ without having to pay its 0.35% ER (still very low for what it’s offering and below-market average for derivatives ETFs), since QQQ’s ER is 0.20%. This means that investors in JEPQ, despite the monthly payments, may be leaving money on the table by not investing in QQQ.
Conclusion
The JPMorgan Nasdaq Equity Premium Income ETF has impressed me with its lower risk and higher yield than traditional Nasdaq-100 exposure ETFs like QQQ. I am giving it a “buy” rating on this premise, but should caution investors that they may underperform the index and carries a lot of management risk, since the strike and stock picking methodologies are opaque.
I recommend that aggressive investors consider up to a 10% allocation to JEPQ in an income portfolio. Conservative investors should consider up to a 5% allocation in an income portfolio. I also recommend conservative investors consider the less volatile sister fund that tracks the S&P 500 index, JEPI.
Thanks for reading.