Medicaid is jointly financed by states and the federal government but administered by states within broad federal rules. Medicaid accounts for a large share of state budgets and can be central to state fiscal decisions. Following years of robust revenue growth, states are now contending with weakening tax revenues, budget shortfalls, and uncertainty in their long-term fiscal outlook, leaving some states with difficult budget decisions. At the same time, there are several options under consideration in Congress to significantly reduce federal Medicaid spending to help pay for tax cuts, with the recently passed House budget resolution targeting cuts to Medicaid of up to $880 billion or more over a decade. There are not yet detailed proposals under consideration by Congress to achieve federal Medicaid spending reductions. However, any reduction in federal Medicaid spending would leave states with tough choices about how to offset reductions through tax increases or cuts to other programs, like education. If states are not able to offset the loss of federal funds with new taxes or reductions in other state spending, states would have to make cuts to their Medicaid programs. This brief explores the magnitude of federal funding cuts under the House budget resolution and puts the $880 billion in context by comparing the size of the cuts to states’ tax revenues, spending on education, and the number of Medicaid enrollees covered for that cost. The analysis assumes $880 billion in federal Medicaid cuts over a decade, though the amount could end up being more or less depending on what Congress passes.
Key Take-Aways
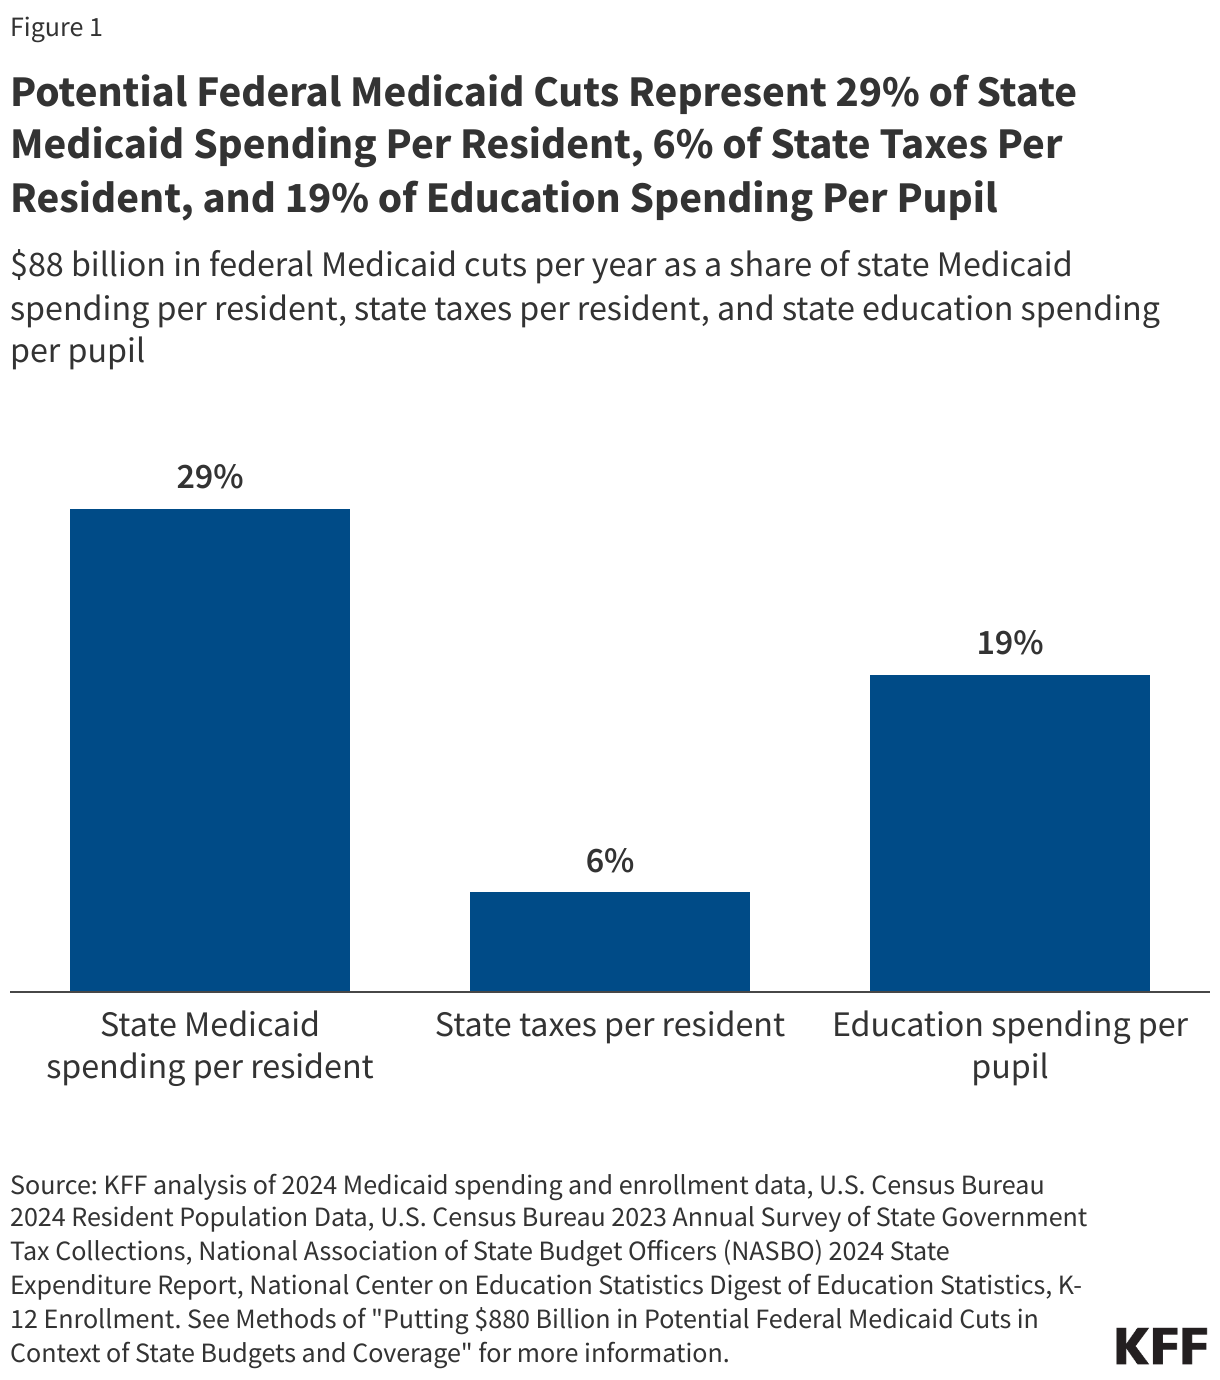
- Federal cuts of $880 billion over 10 years (or $88 billion per year) would represent 29% of state-financed Medicaid spending per resident.
- States could opt to raise tax revenues to offset federal Medicaid reductions. Proposed federal cuts represent 6% of state taxes per resident.
- States could instead make cuts to other states programs such as education, the largest source of expenditures from state funds, to offset federal Medicaid reductions. Proposed federal cuts represent 19% of state education spending per pupil.
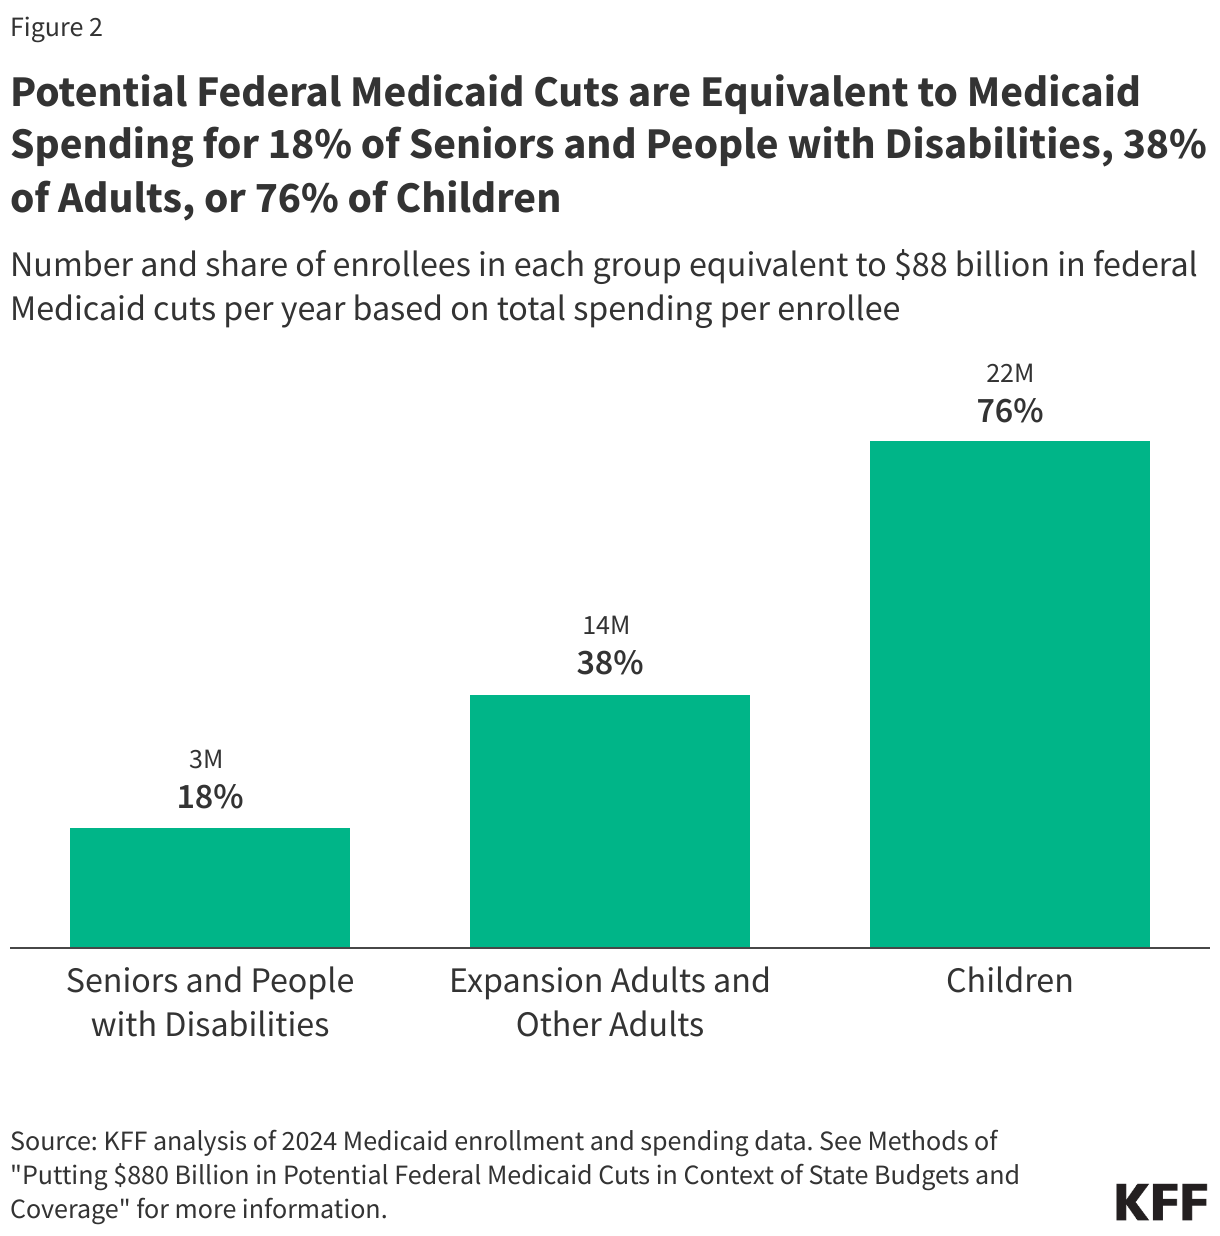
- To further put the proposed federal cuts in perspective, they are equivalent to all Medicaid spending on 3 million seniors and people with disabilities (18% of enrollees in that group), 14 million other adults (38% in that group), or 22 million children enrolled in Medicaid (76% of that group). These figures are meant to put the magnitude of the cuts in perspective, not to suggest that states would achieve savings by eliminating coverage by these amounts. The effects of federal cuts on Medicaid spending and coverage would depend on the specific policies enacted.
What is the size of federal Medicaid reductions under consideration?
Congress is currently targeting up to $880 billion or more in federal Medicaid spending reductions. The House passed a budget resolution instructing the House Energy & Commerce Committee (E&C) to reduce the federal deficit by at least $880 billion over 10 years. Although the budget resolution does not mention Medicaid, Medicaid comprises $8.2 trillion out of the $8.6 trillion in mandatory spending that E&C must use to come up with spending reductions (assuming Medicare cuts are off the table). As a result, major cuts to Medicaid are the only way to meet the House’s budget resolution required $880 billion (or more) in spending reductions.
This is an illustrative analysis designed to portray the potential impact of $880 billion in Medicaid cuts in the absence of specific policies that would yield federal savings. This analysis assumes that the $880 billion in cuts over a decade are spread uniformly across 10 years, or $88 billion a year, which represents 16% of federal Medicaid funding in federal fiscal year (FY) 2024. While this analysis applies cuts evenly across the 10-year period to get a one-year estimate, in practice, the cuts could grow over time. Policies are often implemented after a period of preparation and some may require multiple years before the effects are fully observed.
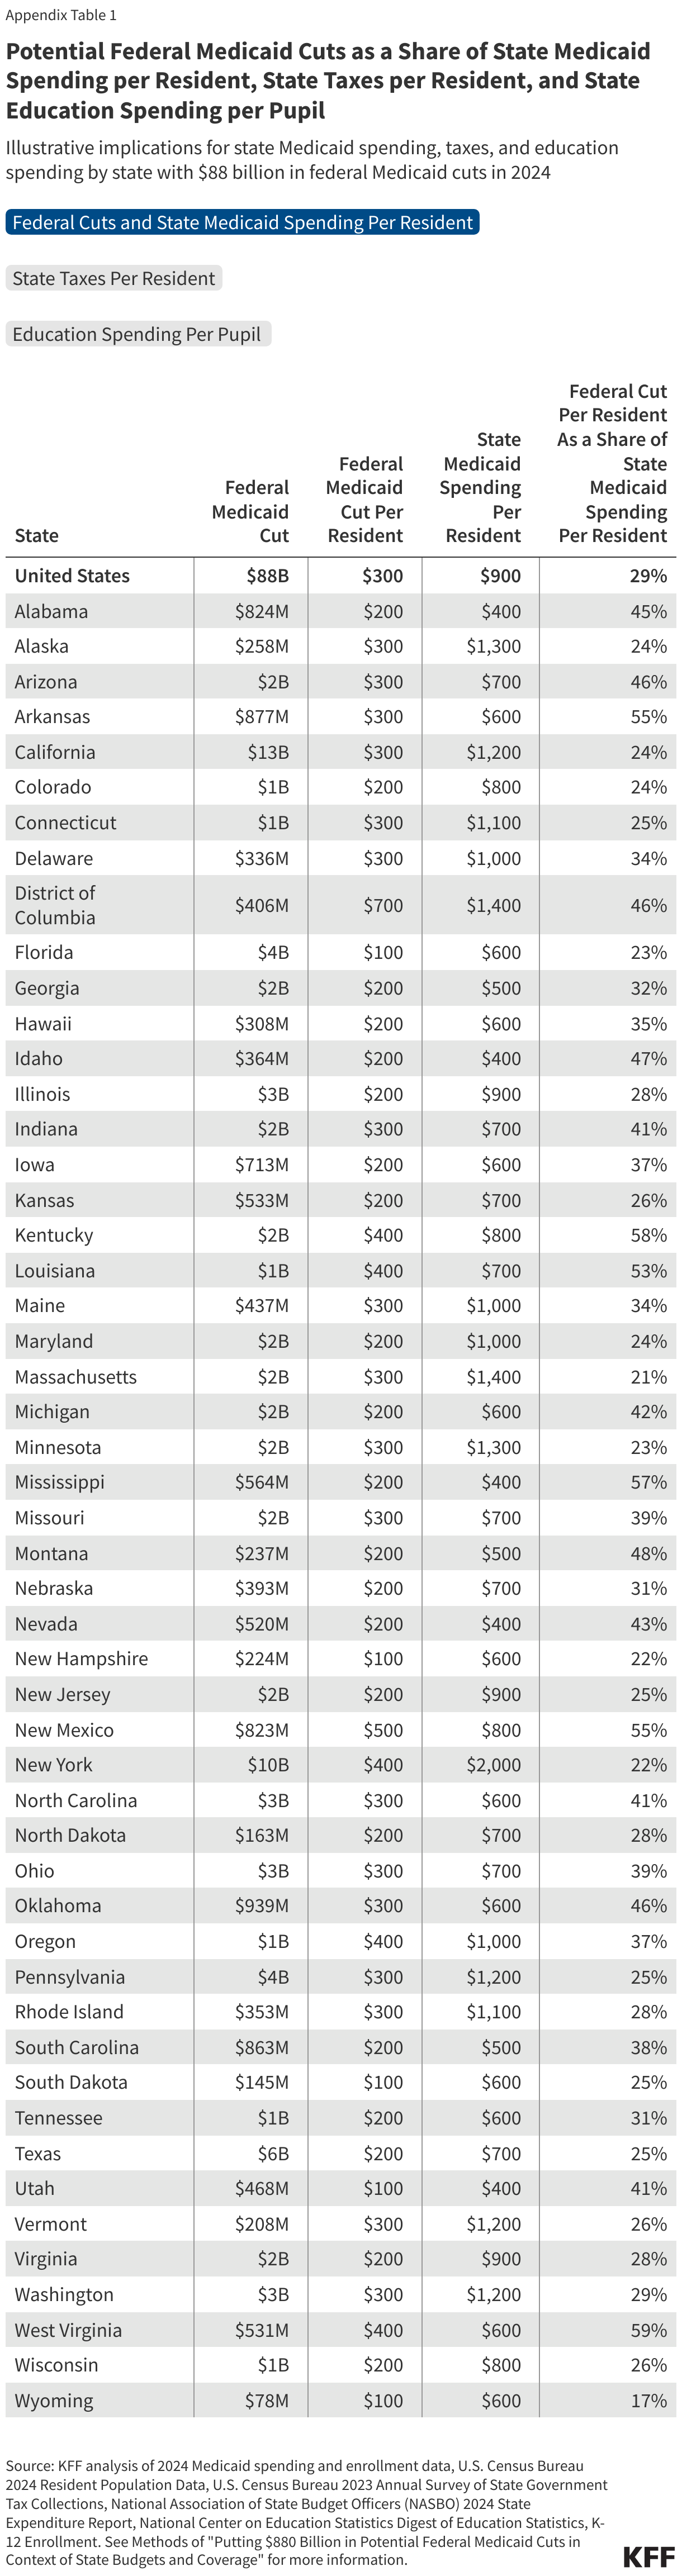
The analysis applies the federal cuts proportionally across states for illustrative purposes, though the distributional effects would vary depending on the specific policy changes proposed. This analysis applies the federal cuts proportionally to states based on their share of federal spending, resulting in a 16% cut to federal Medicaid funding across all states, though the total amount of the cuts varies by state, ranging from $78 million to $13 billion (Appendix Table 1). In practice, cuts would almost certainly not be allocated proportionately, and some states would be disproportionately impacted depending on the specific policy proposals pursued. Without specific policies yet under consideration by Congress, this illustrative analysis is a way of understanding the magnitude of the potential Medicaid cuts.
How does $880 billion in federal Medicaid reductions relate to states’ taxes and education spending?
Federal Medicaid cuts of $88 billion per year would represent 29% of state-financed Medicaid spending per resident (Figure 1). For states to maintain Medicaid spending and eligibility at current levels, they would have to increase state spending by $88 billion each year, shifting costs from the federal government to the states. This would result in a 29% increase in state-financed Medicaid spending per resident in FY 2024. Across states, the federal cuts per resident range from $100 to $700, representing anywhere from 17% to 59% in state Medicaid spending per resident (Appendix Table 1). These findings are based on the assumptions above; in practice, the increase in state Medicaid spending per resident would vary based on the specific policy proposals.
States could opt to raise taxes to offset the federal Medicaid cuts, with $88 billion per year in federal Medicaid cuts representing 6% of state taxes per resident nationwide. Total state taxes per resident ranged from $2,530 to $15,225 across states (Appendix Table 1). The federal cuts per resident range from $100 to $700 across states, representing anywhere from 2% to 11% in state tax dollars per resident.
Another option for states is to make cuts to another budget item like K-12 education, with proposed federal Medicaid cuts representing 19% of state spending on education per pupil. States could make cuts to any areas of state spending, but education is the largest source of expenditures from state funds, so it is used as an illustrative example in this analysis. Total education spending is primarily from state and local governments, with a small share financed by the federal government. Reductions in state government spending for K-12 education would have a direct impact on total spending per-pupil. State education spending per pupil ranges from $4,500 to $28,600 across states (Appendix Table 1). The federal cuts per pupil range from $700 to $3,400 across states, representing anywhere from 7% to 38% in state education spending per pupil.
How does $880 billion in federal Medicaid reductions relate to Medicaid coverage by eligibility group?
If states do not offset federal Medicaid cuts by picking up the new costs, they could reduce Medicaid spending by covering fewer people, offering fewer benefits, or paying providers less. To reduce eligibility, states would have to make tough choices about what enrollment groups to apply eligibility restrictions to given variation in enrollment and spending per enrollee across groups. It is unclear if more specific federal policy proposals will disproportionately affect certain eligibility groups (like the Affordable Care Act expansion group), or make changes to minimum eligibility standards or benefits set by the federal government. Also, depending on the specific policy proposals and assuming the matching structure of Medicaid financing is retained, states would have to reduce total Medicaid spending by more than one dollar to achieve a dollar in savings.
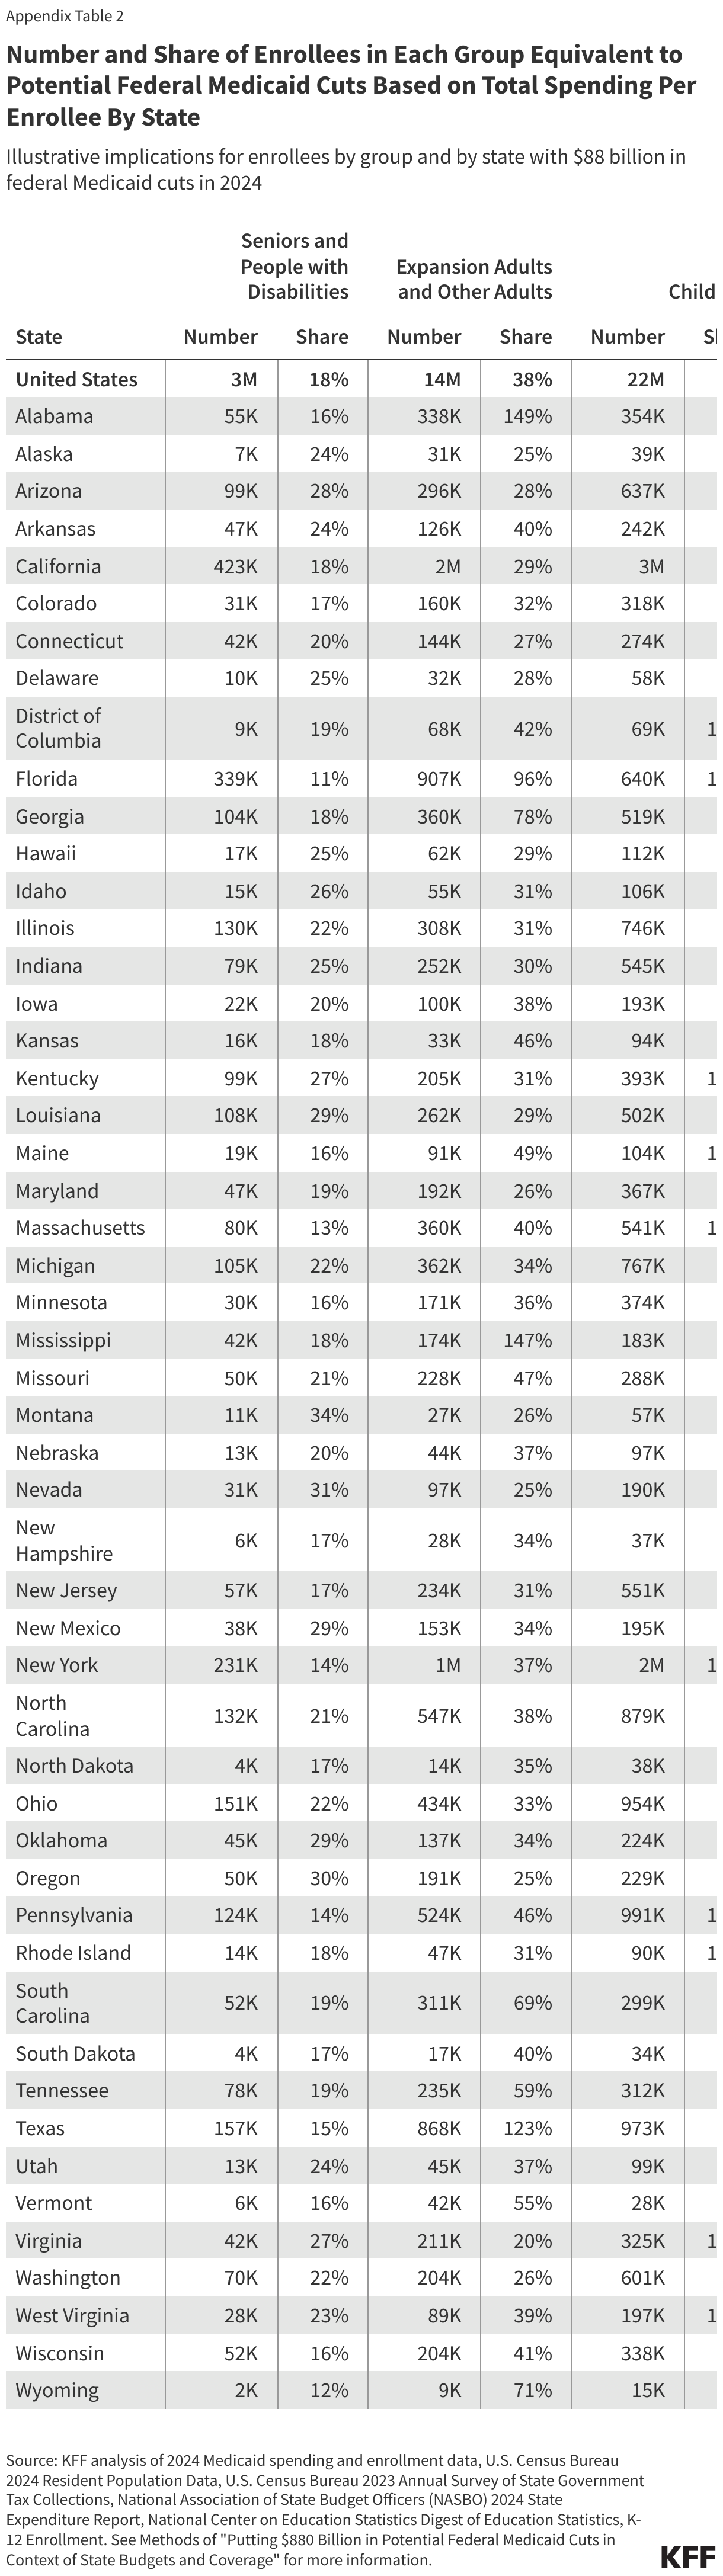
To provide context for the scope of proposed cuts to Medicaid, the following analysis shows how many people’s Medicaid benefits are covered with $88 billion. The numbers are presented across different enrollee groups to account for significant differences in Medicaid costs for different groups of enrollees (see Methods).
To put the proposed federal cuts into perspective, they are equivalent to all Medicaid spending on 3 million or 18% of Medicaid enrollees eligible because they are 65 and older or have a disability, 14 million or 38% of adult Medicaid enrollees, or 22 million or 76% of child enrollees (Figure 2). Spending per enrollee varies across eligibility groups and is over $18,000 per year for seniors and people with disabilities compared to $3,000 per year for children. As a result, a $88 billion a year cut would be equivalent to Medicaid spending on a smaller number of seniors and people with disabilities relative to other populations both nationally and across states (Appendix Table 2).
Appendix
Methods |
| Data: This analysis uses the latest data available from various data sources to illustrate the potential impact of an $88 billion cut to federal Medicaid spending across states. Data sources include:
State Medicaid data from NASBO is reported for the state fiscal year (instead of federal fiscal year) and differs from other sources of Medicaid spending data. For that reason, this analysis uses spending per resident or pupil calculations to relate data across the various sources. Estimating Annual Federal Cut: This analysis assumes that the $880 billion in cuts over a decade are spread uniformly across 10 years, or $88 billion a year cut, which represents 16% of federal Medicaid funding in FY 2024. Allocating $88 Billion Across States: This analysis applies the one-year federal cut proportionally to states based on their share of federal spending in FY 2024 from KFF’s projections of Medicaid spending under current law. The federal share of spending is estimated using a 90% match rate for the ACA expansion group and the FY 2024 traditional federal match rates plus a 1.5 percentage point increase for the first quarter of FY 2024 (accounting for the final phase out quarter of the pandemic-era enhanced federal match rate) for the remaining eligibility groups. This results in a 16% cut to federal Medicaid funding across all states, though the total amount of the cuts varies by state. Lastly, the federal cuts are then divided by the U.S. Census Bureau’s 2024 estimates of resident population by state to get an estimate of federal cuts per resident by state. Estimating State Medicaid Spending Per Resident: State spending per resident in FY 2024 is estimated using KFF’s projections of Medicaid spending under current law (assuming state spending is the difference between total spending and federal spending) and the U.S. Census Bureau’s 2024 estimates of resident population by state. The federal cuts per resident are then divided by state Medicaid spending per resident to estimate the federal cuts as a share of state Medicaid spending per resident. Estimating State Taxes Per Resident: State taxes per resident in FY 2023 from the U.S. Census Bureau’s Annual Survey of State Government Tax Collections (the latest data available and available for download here) is used as an estimate for state taxes per resident in FY 2024. The federal cuts per resident are then divided by state taxes per resident to estimate the federal cuts as a share of state taxes per resident. Estimating State Education Spending Per Pupil: State education spending in FY 2024 is estimated from NASBO’s 2024 State Expenditure Report (the latest available data). The analysis combines state general fund and other state fund spending on elementary and secondary education in estimated state fiscal year 2024 to approximate state education spending in FY 2024. This is divided by the number of K-12 students enrolled in fall 2023 by state (the latest data available) from the National Center on Education Statistics, Digest of Education Statistics to get state education spending per pupil. The total federal cuts by state are then divided by the number of students by state to get an estimate of federal cuts per pupil. Finally, the federal cuts per pupil are then divided by state education spending per pupil to estimate the federal cuts as a share of state education spending per pupil. Estimating Coverage Costs By Eligibility Group: Total Medicaid spending per enrollee for the three enrollment groups (seniors and people with disabilities, expansion adults and other adults, and children) in FY 2024 is calculated using KFF’s projections of Medicaid spending and enrollment under current law. To estimate how many enrollees in each group the federal cuts are equivalent to, the federal cuts are divided by the per enrollee estimate for each group and by state. |