
Key Highlights
- NZD/USD started a fresh increase above the 0.5620 resistance.
- A key bullish trend line is forming with support at 0.5670 on the 4-hour chart.
- EUR/USD is still struggling to clear the 1.0520 resistance zone.
- GBP/USD could extend gains if it settles above 1.2630.
NZD/USD Technical Analysis
The New Zealand Dollar formed a base and started a fresh increase against the US Dollar. NZD/USD surpassed the 0.5600 and 0.5650 resistance levels.
Looking at the 4-hour chart, the pair settled above the 0.5670 level, the 100 simple moving average (red, 4-hour), and the 200 simple moving average (green, 4-hour). The pair even tested the 0.5750 zone before there was a minor pullback.
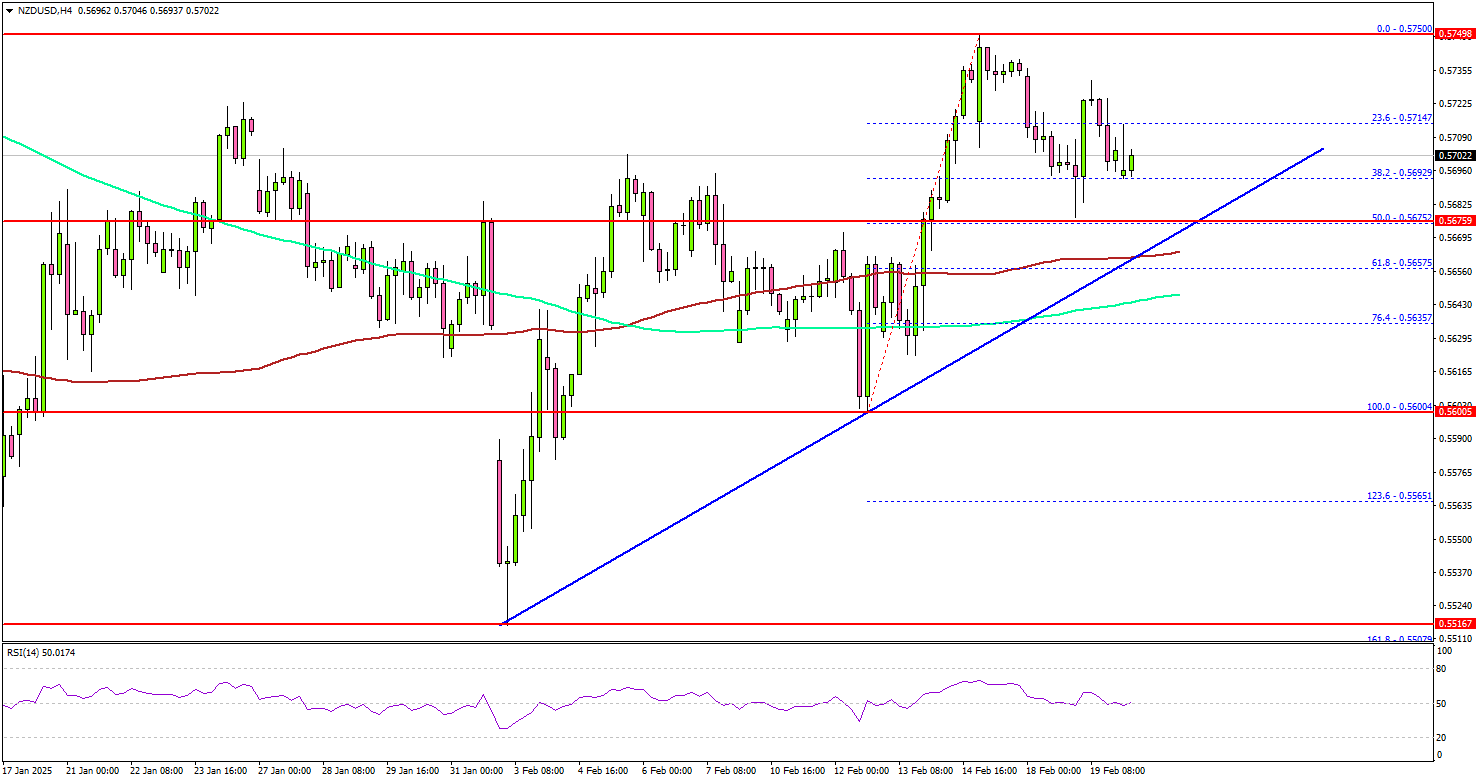
The pair dipped and tested the 50% Fib retracement level of the upward move from the 0.5600 swing low to the 0.5750 high. On the downside, immediate support sits near the 0.5690 level.
The next key support sits near the 0.5670 level. There is also a key bullish trend line forming with support at 0.5670 on the same chart. The main support could be 0.5655 and the 61.8% Fib retracement level of the upward move from the 0.5600 swing low to the 0.5750 high.
Any more losses could send the pair toward the 0.5600 level. On the upside, the pair seems to be facing hurdles near the 0.5750 level. The next major resistance is near the 0.5800 level. The main resistance is now forming near the 0.5840 zone.
A close above the 0.5840 level could set the tone for another increase. In the stated case, the pair could even clear the 0.6000 resistance.
Looking at EUR/USD, the pair remained stable above 1.0450 but the bears are still active near the 1.0520 resistance.
Upcoming Economic Events:
- US Initial Jobless Claims – Forecast 215K, versus 213K previous.
- Philadelphia Fed Manufacturing Index for Feb 2025 – Forecast 20, versus 44.3 previous.

