JamesBrey
By Bill Zox, CFA & Dylan Herrmann, CFA
An analysis of past Federal Reserve easing cycles and subsequent economic outcomes tells a story of consistency and stability for US high yield.
With the specter of excessive inflation largely faded, market concern has turned to the weakening labor market. This shift has driven calls for aggressive Federal Reserve (Fed) interest rate cuts, with futures markets pricing over 100 basis points of cuts by the end of the year and more than nine cuts over the next eight Federal Open Market Committee (FOMC) meetings, according to CME FedWatch and Bloomberg data as of September 9. While market participants debate the pace of cuts and the Fed’s ability to engineer a soft landing, the US high yield market, measured by the ICE BofA US High Yield Index, continues to deliver solid returns. These results have been driven by attractive starting yields, declining base rates, strong fundamentals, and a healthy supply/demand dynamic. An analysis of past Fed easing cycles and subsequent economic outcomes tells a story of consistency and stability for high yield.
Looking at the past five cutting cycles back to the inception of the ICE BofA US High Yield Index, it is important to note that no cycle is the same. However, it is said that history does not repeat itself, but it often rhymes. Past cycles serve to inform how markets may perform moving forward.
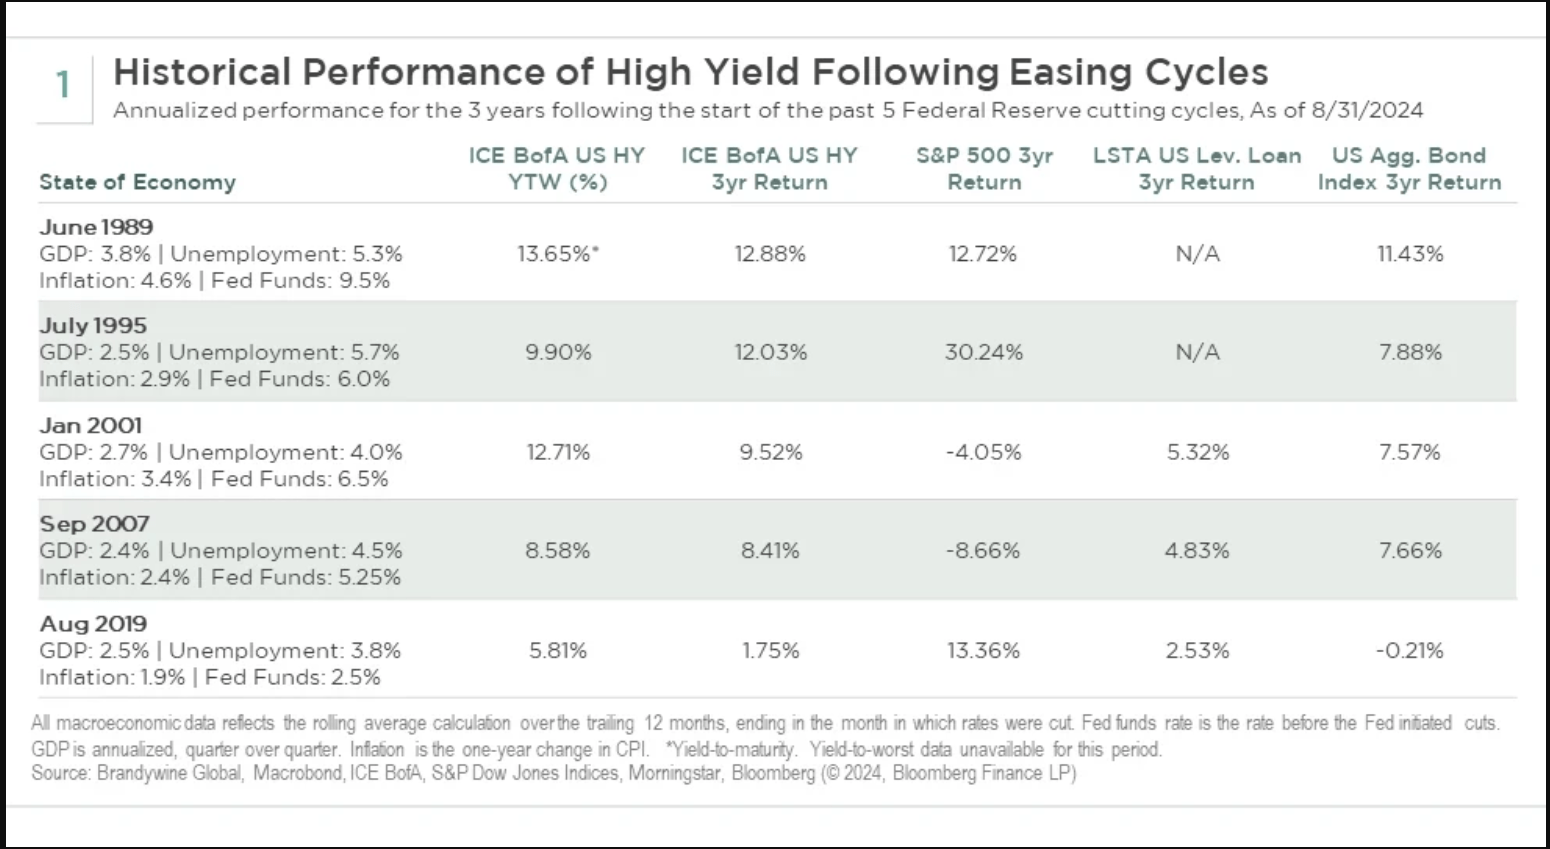
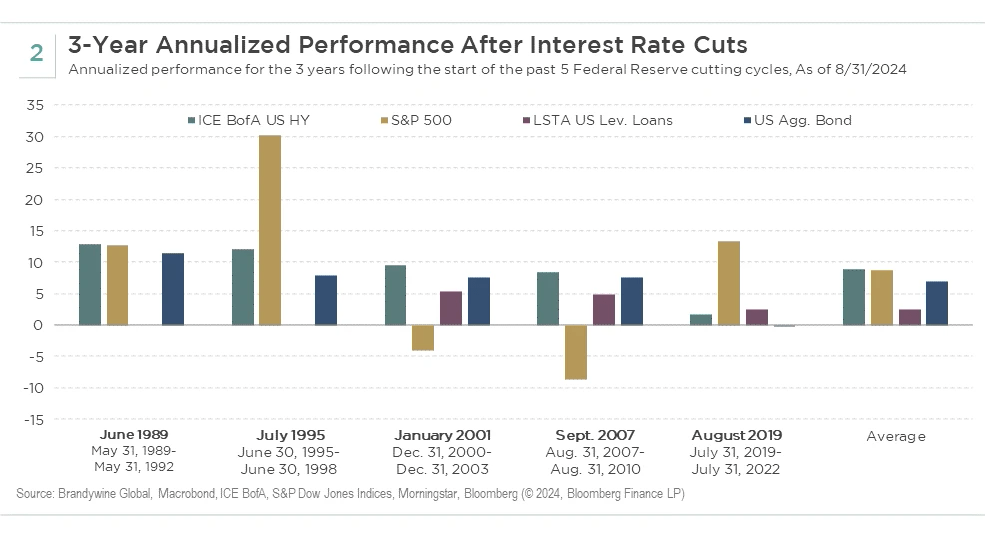
To best capture the spectrum of scenarios, we are focusing on two distinctly different cycles and economic outcomes: the 1995 cutting cycle that led to a soft landing and a robust rally for risk assets; and the 2007 cutting cycle that led to a deep and prolonged recession. In both cases, starting conditions were somewhat comparable to each other, and in most respects in the ballpark of where we are today. Gross domestic product (GDP) growth between 2% and 3% was in a reasonable range of what is often considered a healthy long-term target, while unemployment near 5% indicated some economic weakness. These factors, combined with inflation below 3%, allowed for the Fed to begin to ease interest rates that were over 5%. What followed is where the major differences begin.
The soft landing following the 1995 cutting cycle was characterized by strong GDP numbers, a stable labor market, and lower inflation as the advent of the internet boosted productivity. Risk assets performed notably well, with the S&P 500 Index returning over 30% on an annualized basis over the three-year period that followed the initial rate cuts. On the other hand, the 2007 cutting cycle was followed by a hard landing, where unemployment spiked to near 10%, and the economy declined substantially, largely due to the bursting of the housing bubble and financial system with excessive leverage. Risk assets suffered as a result, with the S&P 500 returning -8.7% annualized over the ensuing three-year period. However, the US high yield market held up well during both periods, returning 12.0% in the soft-landing environment and 8.4% in the hard-landing environment on a three-year annualized basis. These similar outcomes for high yield despite different economic results were largely attributable to attractive starting yields and, in the case of the hard landing, the resilience of a lower-duration, senior asset class. High yield also outperformed core bonds, which are viewed as a “safe haven” during recessionary times, over both periods due to higher starting yields. This demonstrated resiliency of high yield as an asset class is a testament to why we believe it should be a core allocation in many portfolios.
The high yield market today is higher quality than in past cycles, while still offering an attractive price and yield opportunity. For these reasons, we believe it will hold up well regardless of where the economy lands, and patient investors will be rewarded over the long term similar to previous cycles.
Index Definitions
ICE BofA US High Yield Index tracks the performance of USD-denominated below investment grade corporate debt publicly issued in the major domestic markets.
S&P 500 Index is a broad measure of U.S. domestic large cap stocks. The 500 stocks in this capitalization-weighted index are chosen based on industry representation, liquidity, and stability.
Morningstar LSTA US Leveraged Loan Total Return Index is a market value-weighted index designed to measure the performance of the US leveraged loan market based upon market weightings, spreads, and interest payments.
Bloomberg US Aggregate Bond Index represents securities that are SEC-registered, taxable, and dollar denominated. The index covers the U.S. investment grade fixed-rate bond market, with index components for government and corporate securities, mortgage pass-through securities, and asset-backed securities.
Consumer Price Index (CPI) is used to measure the change in the out-of-pocket expenditures of all urban households for a particular set of goods and services. In terms of its coverage, the CPI measures the cost of spending made directly by households for the items in its basket, with the notable exception that it also includes a measure of the rents that homeowners implicitly pay instead of renting their home.
Editor’s Note: The summary bullets for this article were chosen by Seeking Alpha editors.