Key Highlights
- GBP/USD started a fresh increase above the 1.2500 resistance.
- A key bullish trend line is forming with support at 1.2400 on the 4-hour chart.
- EUR/USD is struggling to clear the 1.0520 resistance zone.
- Crude Oil prices remained in a bearish zone below the $72.20 level.
GBP/USD Technical Analysis
The British Pound formed a base and started a fresh increase against the US Dollar. GBP/USD surpassed the 1.2450 and 1.2500 resistance levels.
Looking at the 4-hour chart, the pair settled above the 1.2550 level, the 100 simple moving average (red, 4-hour), and the 200 simple moving average (green, 4-hour). The pair even tested the 1.2630 zone before there was a minor pullback.
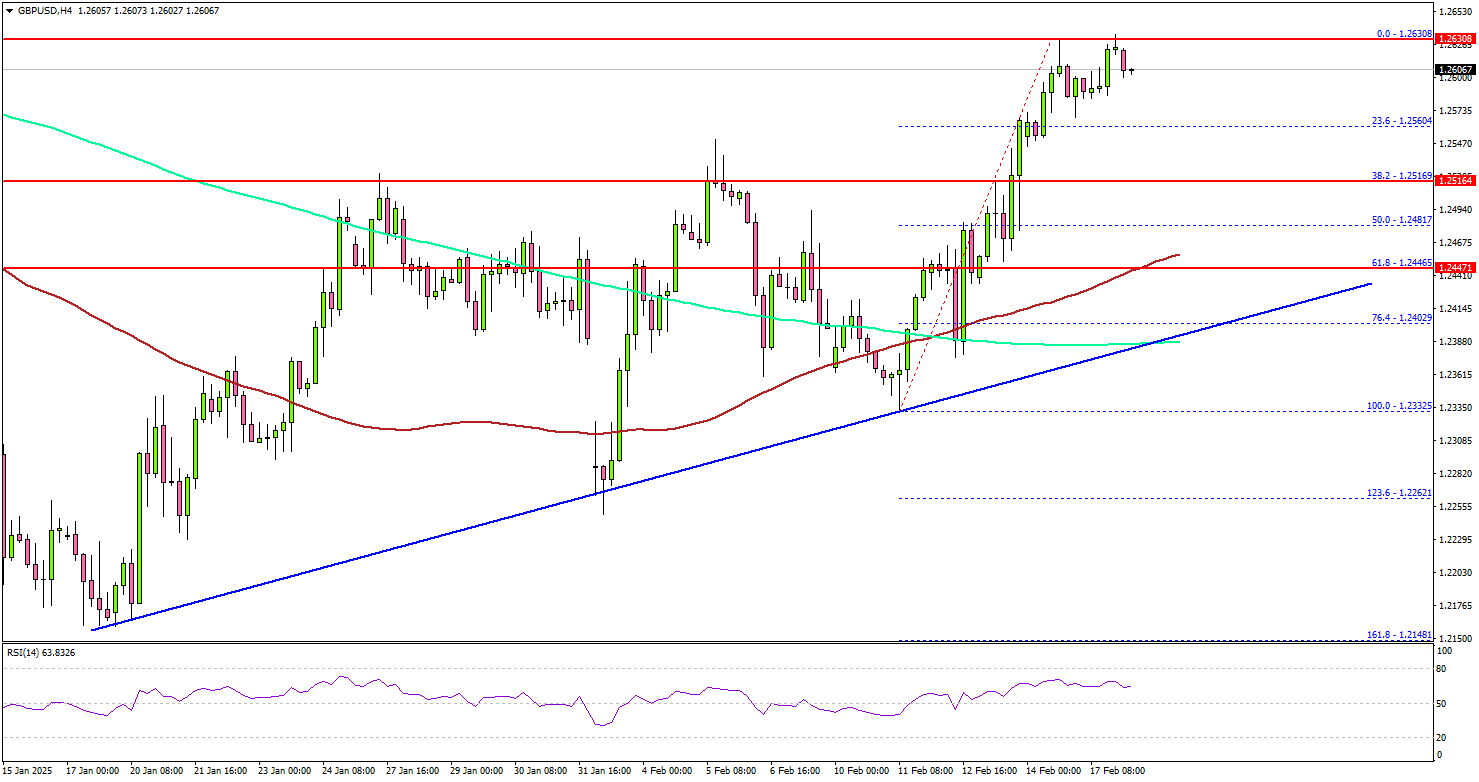
On the downside, immediate support sits near the 1.2515 level. It is near the 38.2% Fib retracement level of the upward move from the 1.2332 swing low to the 1.2630 high.
The next key support sits near the 1.2650 level or the 61.8% Fib retracement level of the upward move from the 1.2332 swing low to the 1.2630 high. The main support could be 1.2400. There is also a key bullish trend line forming with support at 1.2400 on the same chart.
Any more losses could send the pair toward the 1.2250 level. On the upside, the pair seems to be facing hurdles near the 1.2630 level. The next major resistance is near the 1.2665 level. The main resistance is now forming near the 1.2750 zone.
A close above the 1.2750 level could set the tone for another increase. In the stated case, the pair could even clear the 1.2800 resistance.
Looking at EUR/USD, the pair started a decent increase above 1.0450 but the bears are still active near the 1.0520 resistance.
Upcoming Economic Events:
- UK Claimant Count Change for Jan 2025 – Forecast 10.0K, versus 0.7K previous.
- UK ILO Unemployment Rate for Dec 2024 (3M) – Forecast 4.5%, versus 4.4% previous.

