
- The Dow Jones rose slightly on Friday, clipping into fresh weekly highs.
- Equity markets shrugged off a worse-than-expected print from the UoM Consumer Sentiment Index.
- Investors are hoping that more clarity will come from the Trump administration on trade.
The Dow Jones Industrial Average (DJIA) stepped into fresh weekly highs on Friday after investors shrugged off the second-worst print from the University of Michigan’s (UoM) Consumer Sentiment Index on record. Market sentiment remains on the high side as traders hope for further clarity on trade from the Trump administration and a continued easing of President Donald Trump’s tariff policies.
The UoM’s Consumer Sentiment Index sank to 50.8 from 52.2 as consumers’ outlook for economic activity, income, and employment continues to decline. Investors were hoping for an uptick in consumer sentiment, but the average consumer apparently disagrees with Wall Street. Consumer 1-year and 5-year inflation expectations also rose, climbing to 7.3% and 4.6% respectively.
Market sentiment holds on the high end, but dark trade clouds remain
While consumers tend to be terrible at forecasting their economic futures, tariff concerns have been playing havoc on consumers’ feelings about the economy. With inflation expectations continuing to climb, it could pave the way for “profit-led inflation”, or businesses taking the opportunity to raise prices in the face of consumers expecting rising prices. US inflation data came in far better than expected this week, helping to assuage market fears that lopsided US trade policies could shatter the US economy’s still-strong position. However, investors habitually understate the amount of time it takes for government policies to show up in headline data, and tariffs are likely no exception.
According to estimates from the Fitch Ratings agency, the US’s headline Effective Tariff Rate has reached 13% following the Trump administration’s fun new toy of using tariffs to try and control global trade. Prior to widespread tariffs, the US’s ETR was 2.5%. The US’s ETR specifically on China remains above 30% even after the walkback of President Trump’s unhinged 145% import taxes.
The Trump administration has developed a pattern of threatening deeply damaging policy changes before walking them back, temporarily suspending them, or outright canceling them at the eleventh hour. Market perception broadly anticipates a continued clawback of Donald Trump’s policy strategies; however, bullish animal spirits are likely to remain tepid until the Trump administration delivers some solid results and provides some clarity from the many trade agreements that White House staff have been insisting are due to be announced any day now for the last two months.
Dow Jones price forecast
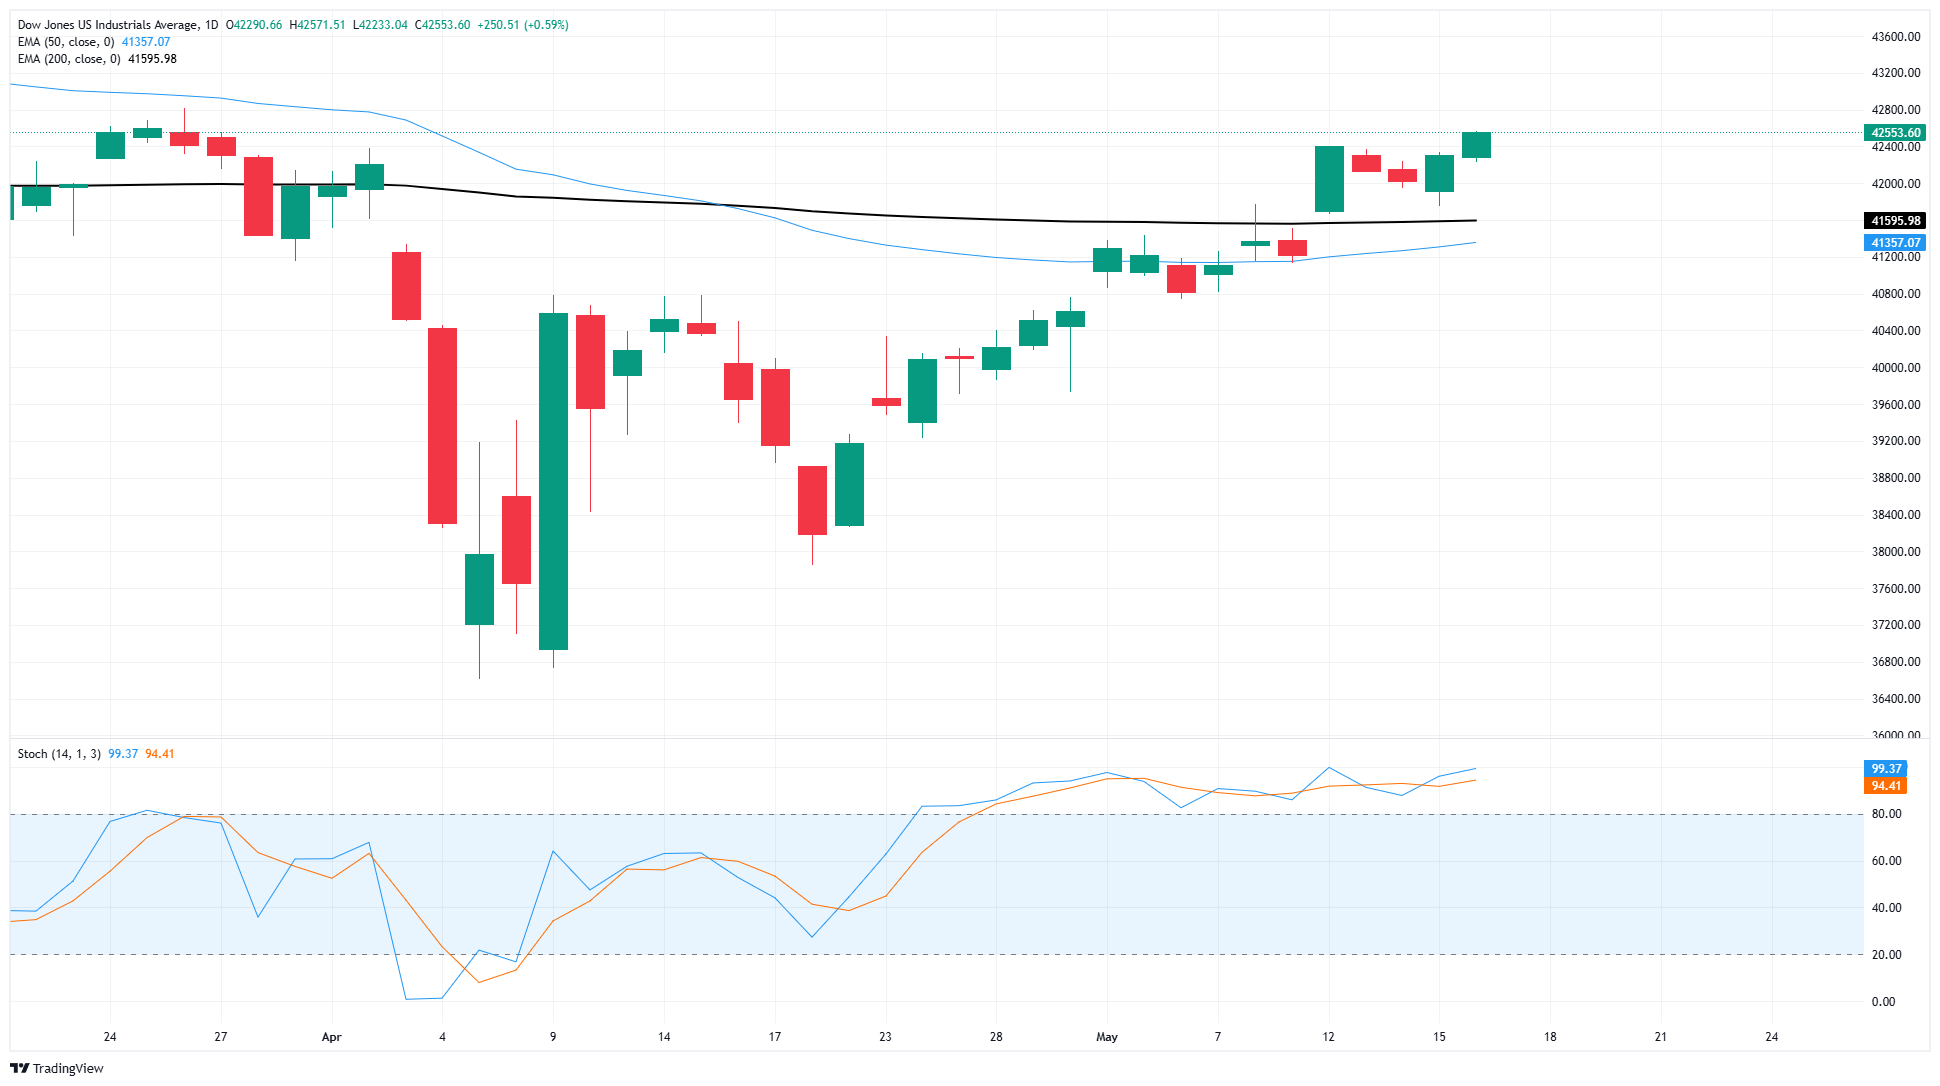
The Dow Jones Industrial Average has finally clawed its way back the 42,500 level for the first time since March. Trade headlines sent US equity markets into a freefall in the first quarter, sending the Dow Jones into the 36,600 region. After weeks of paring back losses, the DJIA is finally back into positive territory for 2025.
Bullish momentum has bolstered the Dow Jones back above the 200-day Exponential Moving Average (EMA) near 41,500, and the DJIA has rebounded 16.25% bottom-to-top. Price action is heading for a technical resistance zone priced in from March’s swing high into 42,800, while the 42,000 handle is set to begin providing a technical floor.
Dow Jones daily chart
Economic Indicator
Michigan Consumer Sentiment Index
The Michigan Consumer Sentiment Index, released on a monthly basis by the University of Michigan, is a survey gauging sentiment among consumers in the United States. The questions cover three broad areas: personal finances, business conditions and buying conditions. The data shows a picture of whether or not consumers are willing to spend money, a key factor as consumer spending is a major driver of the US economy. The University of Michigan survey has proven to be an accurate indicator of the future course of the US economy. The survey publishes a preliminary, mid-month reading and a final print at the end of the month. Generally, a high reading is bullish for the US Dollar (USD), while a low reading is bearish.
Last release:
Fri May 16, 2025 14:00 (Prel)
Frequency:
Monthly
Actual:
50.8
Consensus:
53.4
Previous:
52.2
Source:
University of Michigan

