Written by Nick Ackerman, co-produced by Stanford Chemist
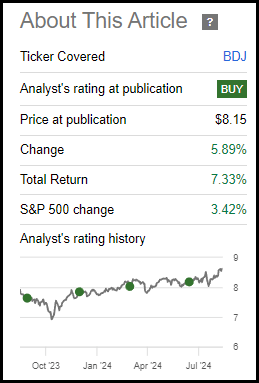
BlackRock Enhanced Equity Dividend Fund (NYSE:BDJ) has been performing well since our last update. Even outpacing the S&P 500 Index in this relatively short period of time. That index isn’t an appropriate benchmark, but it can still provide some context of how broader equities are doing in general. BDJ is a closed-end fund that is positioned with a value-oriented approach and also utilizes a covered call strategy. The fund uses the Russell 1000 Value Index and the MSCI USA Value Call Overwrite Index as its benchmarks.
BDJ Performance Since Prior Update (Seeking Alpha)
Some of these strong results are from the discount narrowing, though the underlying portfolio has also been performing well. Despite the discount narrowing, the fund is still trading at a level where we find it attractive today.
BDJ Basics
1-Year Z-score: 2.24
Discount/Premium: -8.77%
Distribution Yield: 7.81%
Expense Ratio: 0.86%
Leverage: N/A
Managed Assets: $1.717 billion
Structure: Perpetual
BDJ’s primary objective is to “provide current income and current gains.” The fund intends to achieve this by “investing in common stocks that pay dividends and have the potential for capital appreciation.” They concentrate on dividend-paying stocks with “80% of its total assets in dividend-paying equities.”
Discount Narrows But Still Relatively Attractive
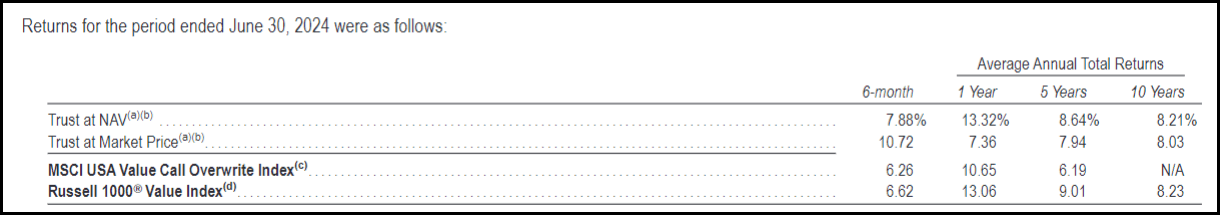
Over the long and short term, the fund has beaten its Russell 1000 Value Index benchmark. This is positive for the fund as a covered call strategy can often lead to a capped upside. However, the fund doesn’t overwrite its entire portfolio, with the latest percentage overwrite at ~50%. Being actively managed means they can also pick and choose which positions they are overwriting as well.
Being that BDJ also employs a covered call strategy, they also include a performance comparison in their reports against the MSCI USA Value Call Overwrite Index. In that case, the fund has topped the index in the three periods shown.
BDJ Annualized Performance Vs. Benchmarks (BlackRock)
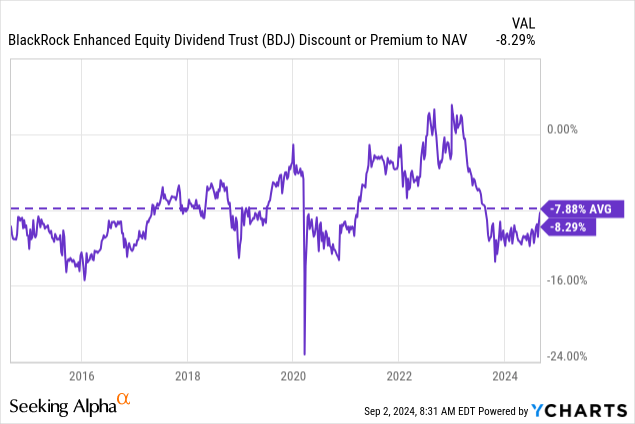
We’ve seen the discount narrow on this fund, and the 1-year z-score certainly suggests it’s looking a bit stretched, at least in the short term. However, over the long term, it’s still looking relatively attractive.
Ycharts
Besides the discount narrowing to help the fund’s performance, the underlying portfolio being positioned more in value-oriented sectors has been a driving factor. There has been a rotation going on where some tech is cooling off—which we actually briefly hit correction territory just last month for the Nasdaq. While tech has recovered from its lows, we are still seeing broader participation in the market. That could be seen by the Invesco S&P 500 Equal Weight ETF (RSP) being the top performer for August over the S&P 500 Index itself.
This started to happen when it became more likely that we were getting interest rate cuts, which is anticipated this month. Value-oriented sectors perform better in a lower-rate environment, and interest rate-sensitive sectors, such as utilities and real estate, also start to look more appealing.
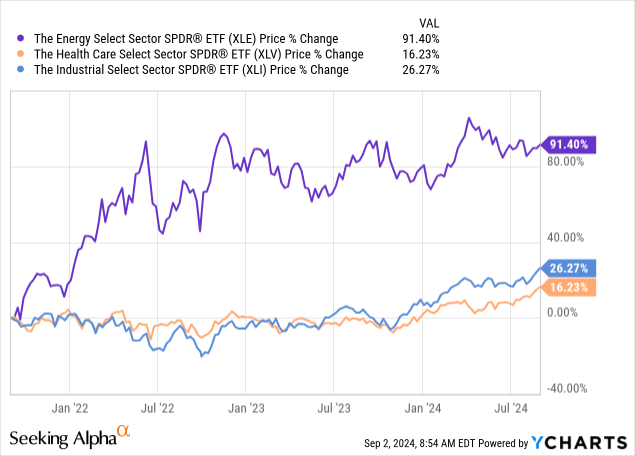
For BDJ, the fund holds significant weightings in financials primarily as the largest sector exposure. Financials have become the top performing sector on a YTD basis now. After that, the fund is invested in healthcare, industrials and energy as the next largest weightings. Energy has been performing well for the last few years, with a strong recovery from the Covid pandemic. Healthcare and industrials, on the other hand, had been relatively weak until this year. They’ve picked up more steam in the last couple of months as well.
Ycharts
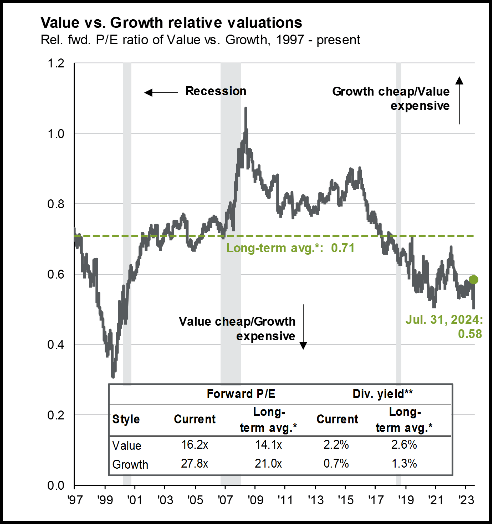
I believe there is a good chance that these areas of the market can continue to perform well. Tech might also perform well, but it is looking pretty richly priced. Here are the P/E valuations from JPMorgan’s “Guide to the Markets” July 31, 2024 update. With tech/growth hitting a correction in early August but then rebounding by the end of the month, we are pretty much right back to where we were, making this chart still relevant.
Value Vs. Growth Valuations (JPMorgan)
The table within the chart suggests that value is actually overvalued relative to its long-term history, but on a relative basis, is still looking much more attractive compared to growth.
Monthly Distribution
Owning a position in BDJ also comes with the added benefit of a monthly distribution, which is appealing to income-focused investors. The distribution rate here is rather modest compared to some other CEFs at 7.81% and a NAV rate of 7.13%.
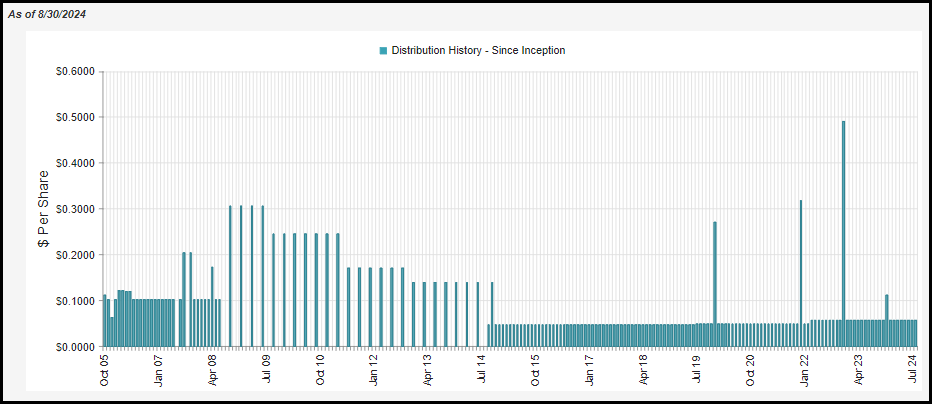
BDJ Distribution History (CEFConnect)
That said, it is still appealing enough, and the more modest payout suggests that there is really no risk of the distribution being cut here. In fact, should the underlying portfolio continue to perform well, as I believe it is positioned to do, we could see an increase in the payout.
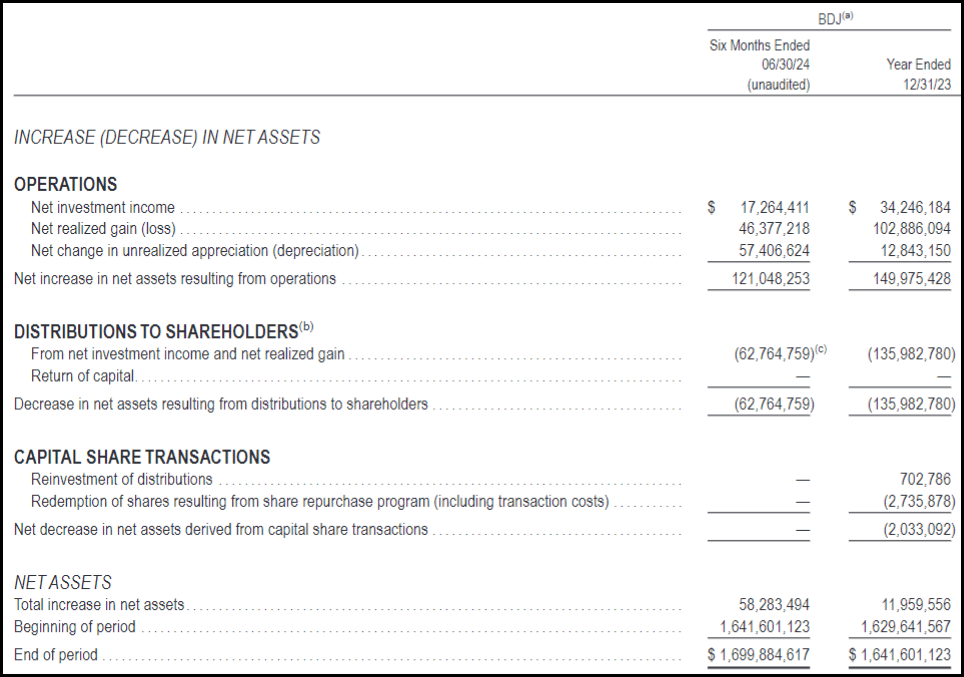
As is the case with almost all equity CEFs, the fund will have to generate capital gains in order to fund the payout. Net investment income coverage in the first half of the year came to 27.5%.
BDJ Semi-Annual Report (BlackRock)
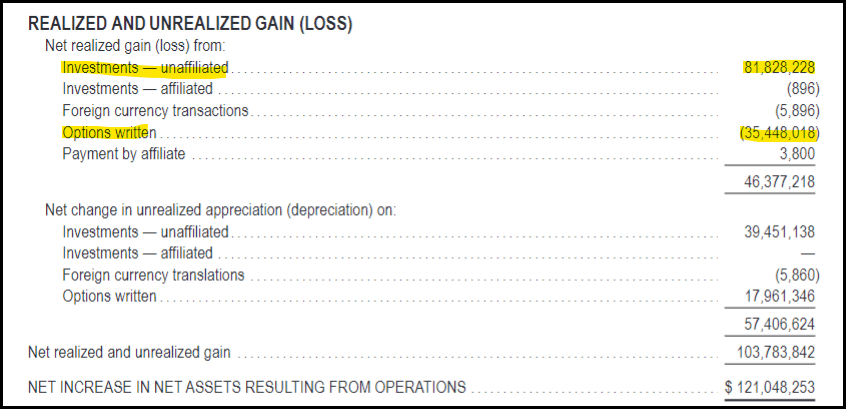
Some of those capital gains can come from writing options as well, collecting the option premium and passing that on to their investors. However, in the first half of the year, the options writing strategy actually generated realized losses.
These losses were partially offset by the unrealized gains from writing options, though. Further, in the underlying portfolio they were realizing significant gains and saw unrealized gains rise materially as well.
BDJ Realized/Unrealized Gains/Losses (BlackRock (highlights from author))
Writing options can generate losses if the managers feel that they don’t want a position called away because it has appreciated, and they close out the contracts for a loss—which would translate and be offset by seeing realized and unrealized gains increase.
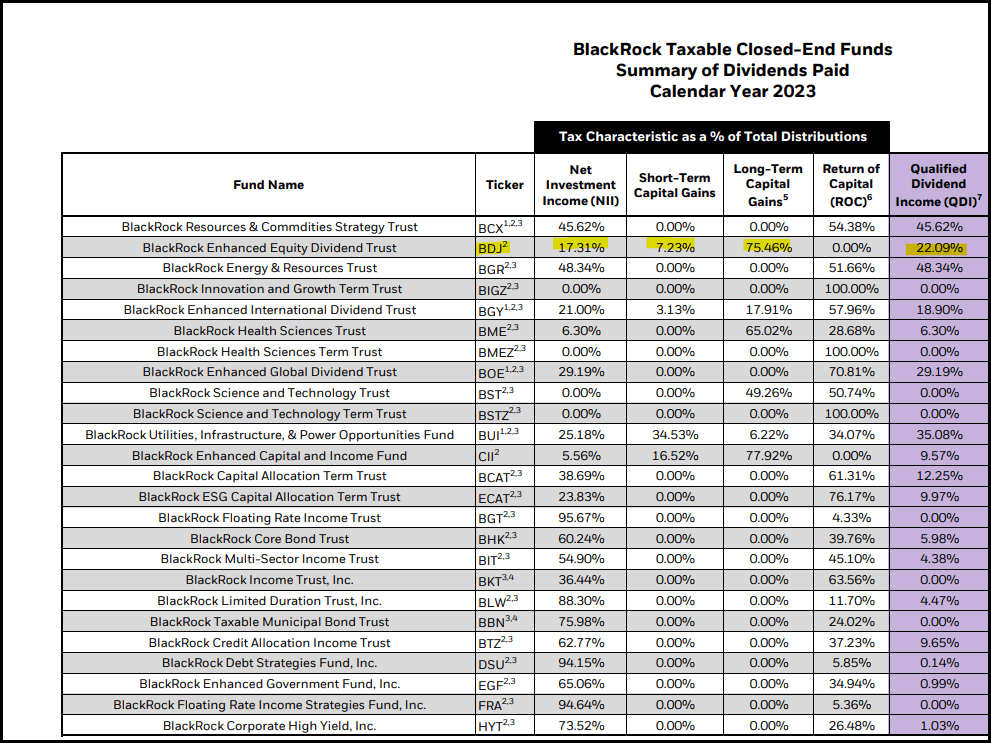
We discussed the distribution tax classifications for 2023 in a prior update earlier this year.
For tax purposes, the fund’s distribution characterizations have largely been similar to the fund’s earnings in terms of income versus capital gains. Given the large-cap focus, there is a portion of the distribution that also qualifies as more tax-friendly qualified dividends.
BlackRock Distribution Tax Classifications (BlackRock (highlights from author))
BDJ’s Portfolio
In general, the fund doesn’t see too much in terms of dramatic shifts between each update. This is mostly in line with where we saw the sector allocations in our prior update, with only some small gyrations. I cover the fund frequently enough, as it is one of my largest positions. Otherwise, there just generally isn’t too much that the managers are doing in terms of sector moves, as they keep the weightings around where their benchmark is positioned.
This also tends to mean that we don’t see a lot of changes in the top ten holdings either.
BDJ Top Ten Holdings June 30, 2024 (BlackRock)
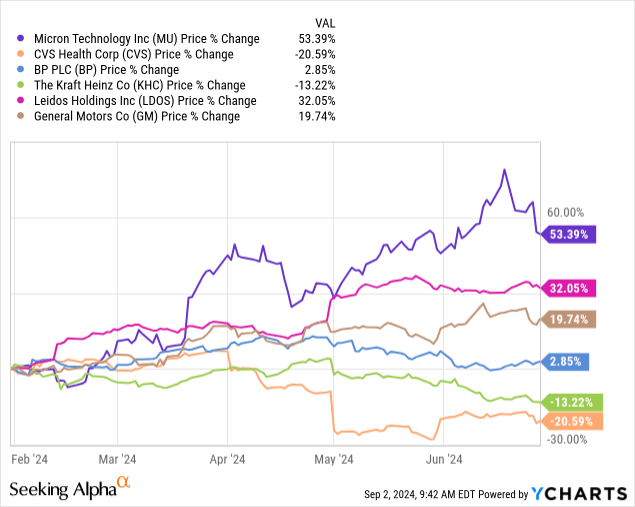
Wells Fargo (WFC) has kept its top spot in the fund, which is where it was near the start of the year as well. A few new names that have shown up are Micron Technology (MU), CVS Health (CVS) and BP (BP). That saw the removal of Kraft Heinz (KHC), Leidos Holdings (LDOS) and General Motors. (GM).
Between the time of the top ten holding updates, MU and LDOS were top performers, and GM wasn’t too far behind. So, this does appear to be a conscious decision in the case of LDOS and GM to trim their positions in those names, or they would otherwise have stayed in the top spot.
Ycharts
MU was previously a position in the fund, at least going back to the December 31, 2023 N-PORT. At that time, the percentage weight was 1.94%, meaning that significant appreciation was a factor in seeing the fund’s increased position.
For KHC being a weak performer during this time, that is what drove the position off the top ten li t. This is actually still a holding in the fund as of their June 30, 2024, N-PORT, but it has drifted down to a 1.96% allocation.
An even worse performer during this period was CVS. That stock declined over 20%, but it now became a top ten position. That means they were adding to this position during the downturn. Going back to the December N-PORT again, CVS was a position in the fund, but it came in at only around a 0.30% weight. That was based on holding 63,370 shares, but they ramped that up significantly over 10x in the latest June N-PORT, listing 649,878 shares.
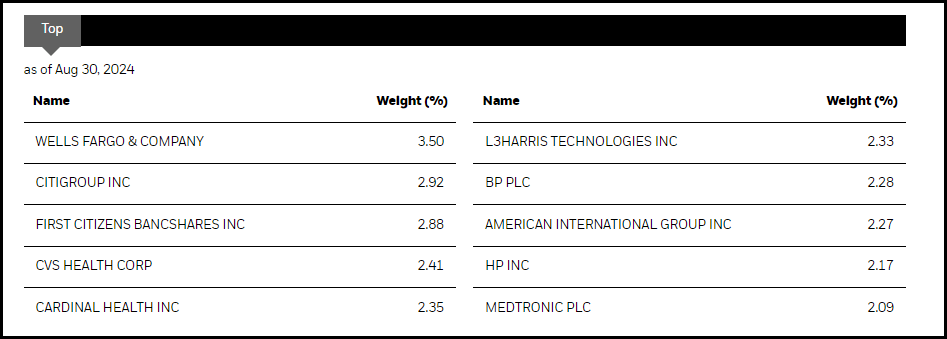
More recently, they provided the updated list of top ten holdings for August 30, 2024. We continue to see a number of financial institutions as the fund’s largest holding, with WFC and C remaining their top spots within the fund.
BDJ Top Ten Holdings August 30, 2024 (BlackRock)
Conclusion
BDJ is set to continue to perform well with its value-oriented portfolio in a lower-rate environment. The fund’s discount, despite narrowing more recently, also still makes it an attractive choice. Though the discount narrowing also means that it becomes less enticing to participate in the potential tender offers. We discussed more on those tender offers in our previous update. We also just finished up the first round, which I touched on recently.
While the tender offers help to add a bit of a floor, at least to a portion of the fund for a period of time while this discount management remains in place, the discount could always widen further. That remains a key risk for any investment in CEFs, as does general market risk. As the fund is invested in equity positions, with financials as the largest allocation that can be sensitive to economic conditions, that certainly can add volatility as well.
Editor’s Note: This article discusses one or more securities that do not trade on a major U.S. exchange. Please be aware of the risks associated with these stocks.