Martin Barraud
Standardized performance (%) as of September 30, 2024
|
Quarter |
YTD |
1 Year |
3 Years |
5 Years |
10 Years |
Since inception |
||
|
Class A (MUTF:ASRAX) shares inception: 05/31/02 |
NAV |
11.40 |
7.00 |
20.50 |
0.61 |
1.89 |
3.74 |
6.85 |
|
Max. Load 5.5% |
5.30 |
1.11 |
13.87 |
-1.28 |
0.73 |
3.16 |
6.58 |
|
|
Class R6 shares inception: 09/24/12 |
NAV |
11.65 |
7.33 |
21.02 |
1.05 |
2.30 |
4.16 |
4.51 |
|
Class Y shares inception: 10/03/08 |
NAV |
11.50 |
7.21 |
20.71 |
0.90 |
2.15 |
4.01 |
5.89 |
|
Custom Global Real Estate Income Index |
16.07 |
11.77 |
28.86 |
0.39 |
1.39 |
4.06 |
– |
|
|
Total return ranking vs. Morningstar Global Real Estate category (Class A shares at NAV) |
– |
– |
95% (178 of 187) |
48% (83 of 179) |
58% (111 of 172) |
66% (81 of 118) |
– |
|
Calendar year total returns (%)
|
2014 |
2015 |
2016 |
2017 |
2018 |
2019 |
2020 |
2021 |
2022 |
2023 |
|
|
Class A shares at NAV |
14.29 |
-1.38 |
4.96 |
8.77 |
-4.33 |
18.67 |
-5.09 |
19.97 |
-20.93 |
11.86 |
|
Class R6 shares at NAV |
14.89 |
-1.10 |
5.40 |
9.23 |
-3.91 |
19.19 |
-4.69 |
20.45 |
-20.63 |
12.34 |
|
Class Y shares at NAV |
14.61 |
-1.15 |
5.23 |
9.06 |
-4.11 |
19.02 |
-4.86 |
20.22 |
-20.71 |
12.19 |
|
Custom Global Real Estate Income Index |
15.02 |
-0.79 |
4.06 |
10.36 |
-5.63 |
21.91 |
-9.04 |
26.09 |
-25.09 |
9.67 |
|
Expense ratios per the current prospectus: Class A: Net: 1.21%, Total: 1.21%; Class R6: Net: 0.82%, Total: 0.82%; Class Y: Net: 0.96%, Total: 0.96%. Performance quoted is past performance and cannot guarantee comparable future results; current performance may be lower or higher. Visit Country Splash for the most recent month-end performance. Performance figures reflect reinvested distributions and changes in net asset value (NAV). Investment return and principal value will vary so that you may have a gain or a loss when you sell shares. Returns less than one year are cumulative; all others are annualized. Index sources: Invesco, RIMES Technologies Corp. Had fees not been waived and/or expenses reimbursed in the past, returns would have been lower. Performance shown at NAV does not include the applicable front-end sales charge, which would have reduced the performance. Class Y and R6 shares have no sales charge; therefore performance is at NAV. Class Y shares are available only to certain investors. Class R6 shares are closed to most investors. Please see the prospectus for more details. For more information, including prospectus and factsheet, please visit Invesco.com/ASRAX Not a Deposit Not FDIC Insured Not Guaranteed by the Bank May Lose Value Not Insured by any Federal Government Agency |
Manager perspective and outlook
The third quarter was marked by economic stimulus measures and central banks easing monetary policy, which apparently boosted investors risk appetites across the world. Global listed real estate had one of its best quarterly returns ever, both on an absolute basis and relative to general equities. The sector’s prospects improved on apparent expectations of lower debt costs amid a solid economic backdrop.
In our experience, listed real estate has delivered strong returns relative to broader equities following central bank easing as investors appear to shift their attention to interest rate sensitive sectors like REITs. Falling interest rates and modest economic growth should in our view lead to good investment opportunities in real estate as a new investment cycle begins. Listed real estate companies with lower capital costs relative to their private real estate peers and strong operating platforms are most likely in our estimation to find attractive investment opportunities.
Global debt markets traded higher during the quarter, driven by the Fed’s interest rate cut and a higher likelihood of a soft landing for the US economy. The commercial real estate debt market may begin to thaw with the help of lower interest rates and increased transactions. However, headwinds in our view, include modest payoff ratios and lower appraisal values in the prolonged commercial real estate cycle.
Portfolio positioning
Top issuers (% of total net assets)
|
Fund |
Index |
|
|
Prologis Inc (PLD) |
6.92 |
6.12 |
|
Equinix Inc (EQX) |
4.18 |
4.42 |
|
Public Storage (PSA) |
3.14 |
3.02 |
|
Rexford Industrial Realty Inc (REXR) |
3.13 |
0.57 |
|
Digital Realty Trust Inc (DLR) |
3.03 |
2.74 |
|
Realty Income Corp (O) |
2.96 |
2.90 |
|
Simon Property Group Inc (SPG) |
2.86 |
2.87 |
|
Alexandria Real Estate Equities Inc (ARE) |
2.72 |
1.08 |
|
Mitsui Fudosan Co Ltd (OTCPK:MTSFF) |
2.55 |
1.32 |
|
UMH Properties Inc (UMH) |
2.22 |
0.07 |
|
As of 09/30/24. Holdings are subject to change and are not buy/sell recommendations. |
||
Asset mix (%)
|
Dom Common Stock |
43.85 |
|
Intl Common Stock |
28.16 |
|
CMO – Non Agency |
18.29 |
|
Dom Preferred Stock |
7.33 |
|
Other |
1.25 |
|
Cash |
1.11 |
At quarter end, the fund’s allocation was 72% real estate equities, 20% commercial mortgage-backed securities (‘CMBS’), 7% preferred securities, 0% corporate bonds and 1% cash. The fund’s asset class allocation was steered toward capturing the rally in real estate equities. We reduced the debt portfolio exposure with the sale of two CMBS holdings in the US lodging sector as underlying property fundamentals for those bonds became in our view less attractive.
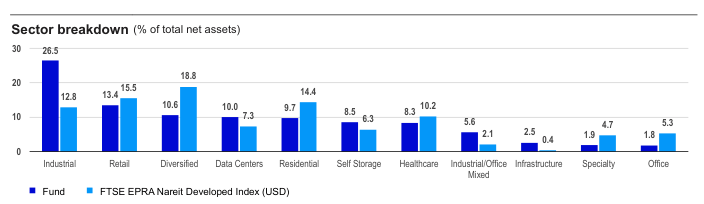
Portfolio positioning reflects our general view that the interest rate environment has become a tailwind for real estate, with some relative value opportunities emerging among more stable property types and sectors. The fund’s real estate equity exposure remains positioned for long-term growth with strong property fundamentals and better tenant conditions. Key overweights include industrials, data centers, infrastructure and self-storage. We believe structural demand trends for data centers will remain intact given a solid earnings growth outlook coupled with artificial intelligence providing a significant tailwind for investor sentiment. Self-storage remains attractive to us as the sector should in our view benefit from easier year-over-year earnings comparisons along with an improving housing environment that we believe should stimulate demand.
The fund has underweights in consumer-facing, economically sensitive REITs and sectors experiencing headwinds, including retail, residential and lodging. The retail underweight is driven by shopping centers, which historically have lower growth prospects and exposure to potentially weaker consumer spending.
The fund’s largest exposure in the debt portfolio is in CMBS. The fund owns securities that we believe are mispriced relative to their underlying property/sector fundamentals. We maintain exposure to single-asset-single-buyer (SASB) CMBS with a focus on recession proof properties in the residential and data center sectors, complemented by value opportunities in the office and lodging sectors.
Performance highlights
|
Top contributors (%) |
||
|
Issuer |
Return |
Contrib. to return |
|
Public Storage |
27.58 |
0.95 |
|
Prologis, Inc. |
12.97 |
0.71 |
|
Equinix, Inc. |
17.93 |
0.68 |
|
Realty Income Corporation |
21.73 |
0.58 |
|
LEG Immobilien SE |
28.15 |
0.49 |
|
Top detractors (%) |
||
|
Issuer |
Return |
Contrib. to return |
|
NATIXIS COMMERCIAL MORTGAGE SECURITIES TRUST 2020-2PAC NCMS 2020-2PAC AMZ3 |
-24.90 |
-0.18 |
|
NATIXIS COMMERCIAL MORTGAGE SECURITIES TRUST 2020-2PAC NCMS 2020-2PAC AMZ2 |
-20.46 |
-0.02 |
|
Host Hotels & Resorts, Inc. |
-0.98 |
-0.01 |
|
Invitation Homes, Inc. |
-1.40 |
-0.01 |
|
Lineage, Inc. |
-1.23 |
0.00 |
The fund had a positive return for the quarter but underperformed its equity-only benchmark, the FTSE EPRA Nareit Developed Index. Equity and debt holdings had positive absolute returns, but both detracted from relative return.
Contributors to performance
Top contributors to relative performance included underweight exposure and security selection in the residential sector along with an overweight in the infrastructure sector. The fund’s infrastructure (cell tower) holdings benefited from the Fed rate cut, which boosted real estate securities with high levels of debt on their balance sheets. The fund’s performance in the residential sector was driven by an underweight in US multi-family properties and an overweight in a German multi-family operator. Underweight exposures in the datacenter and diversified sectors had smaller positive effects on relative return.
Detractors from performance
The fund’s debt holdings in CMBS and preferred securities were the primary detractors from relative return as equities outperformed fixed income for the quarter. Key detractors included fixed rate SASB CMBS bonds on US properties. Additional underperformance came from preferred securities in the lodging and residential sectors.
Key detractors in the equity portfolio included security selection in health care, underweight exposure to the office sector and overweight exposure to the industrial sector. In health care, the fund’s exposures to medical offices and life science offices were the primary detractors. Central bank monetary easing across the globe lifted prospects for deep value sectors such as offices, making the
fund’s underweight a disadvantage. The industrial overweight detracted as structural growth sectors with less discounted valuations underperformed sectors with higher debt rates and slower growth due to the Fed’s interest rate cuts.
Editor’s Note: The summary bullets for this article were chosen by Seeking Alpha editors.
Editor’s Note: This article discusses one or more securities that do not trade on a major U.S. exchange. Please be aware of the risks associated with these stocks.